 Earn with Nexo

Bytecoin Price Analysis BCN / USD: Challenging Recovery
BCN bulls need to put a lot of effort into changing the trend.
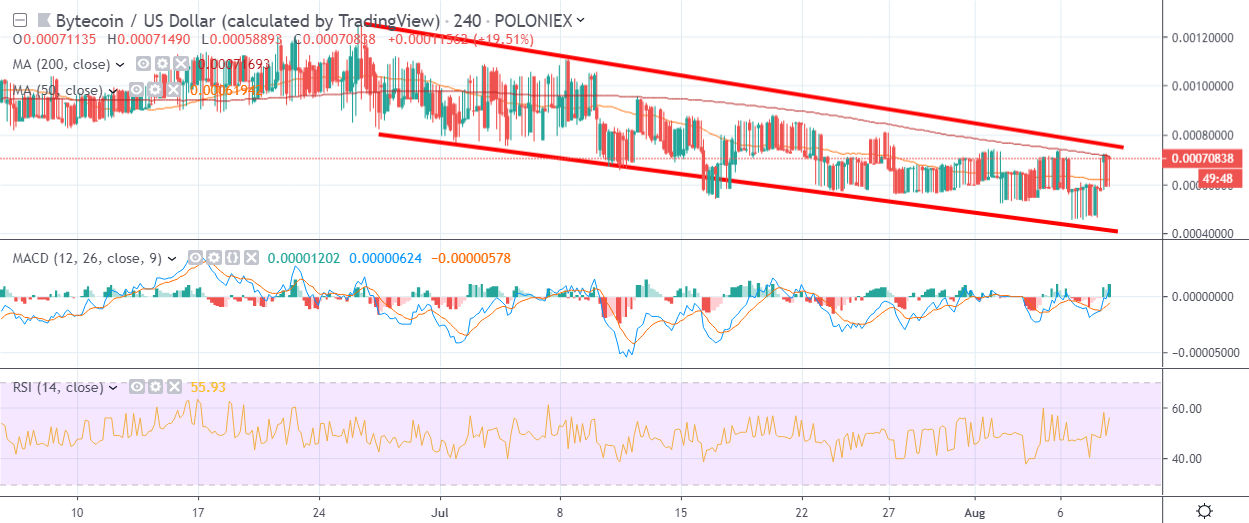
- Bytecoin has bearish short-term outlook, with price still capped below the BCN / USD pair’s 200-period moving average on the four-hour time frame
- The four-hour time frame shows that price is still trapped within a falling price channel
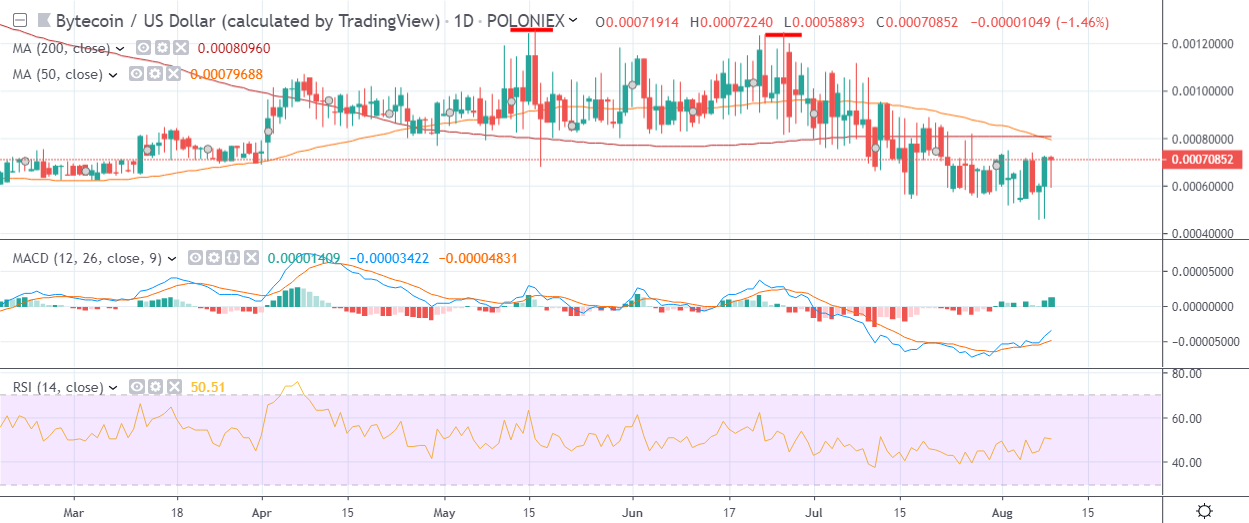
- A daily time frame shows a bearish double-top pattern formation weighing on the cryptocurrency
Bytecoin / USD Short-term price analysis
Bytecoin has a bearish short-term trading bias, with the BCN / USD pair still trading below its 200-period moving average on the four-hour time frame.
The four-hour time frame is showing that the BCN / USD pair is attempting to recover bullish momentum and attempting to break away from a falling price channel.
Technical indicators on the four-hour time frame are bullish and continue to issue strong buy signals.
Pattern Watch
Traders should note that falling price channels are typically considered bullish reversal patterns.
Relative Strength Index
The RSI indicator has turned bullish on the four-hour time frame and is now issuing a buy signal.
MACD Indicator
The MACD indicator is bullish on the four-hour time frame and continues to issue a strong buy signal.
Bytecoin / USD Medium-term price analysis
Bytecoin has a bearish medium-term bias, with price still trading below the BCN / USD pair’s trend defining 200-day moving average.
The daily time frame is showing that a bearish double-top pattern is weighing on sentiment over the medium-term. The 50-day moving average is also close to crossing over the 200-day moving average, further dampening the medium-term technical outlook.
Technical indicators across the daily time frame are attempting to turn bullish.
Pattern Watch
Traders should continue to monitor the trading action around the neckline of the double-top pattern.
Relative Strength Index
The RSI indicator is attempting to move higher on the daily time frame, although it remains technically bearish.
MACD Indicator
The MACD indicator on the daily time frame is starting to issue a buy signal.
Conclusion
Bytecoin remains technically bearish across both time frames despite the recent solid rebound in the emerging cryptocurrency.
Bulls now need to break out from the falling price channel on the four-hour time frame and negate the bearish moving average crossover developing across the daily time frame.
Check out Bytecoin in our coin guide.