
Bytecoin Price Analysis BCN / USD: Death Cross
The intersection of its 50-day and 200-day lines presents danger.
- Bytecoin is bearish in the short-term with price creating bearish lower lows and lower highs
- The four-hour time frame shows that a bearish head and shoulders pattern has been triggered
- A daily time frame shows that the 50-day moving average is close to crossing over the 200-day moving average
Bytecoin / USD Short-term price analysis
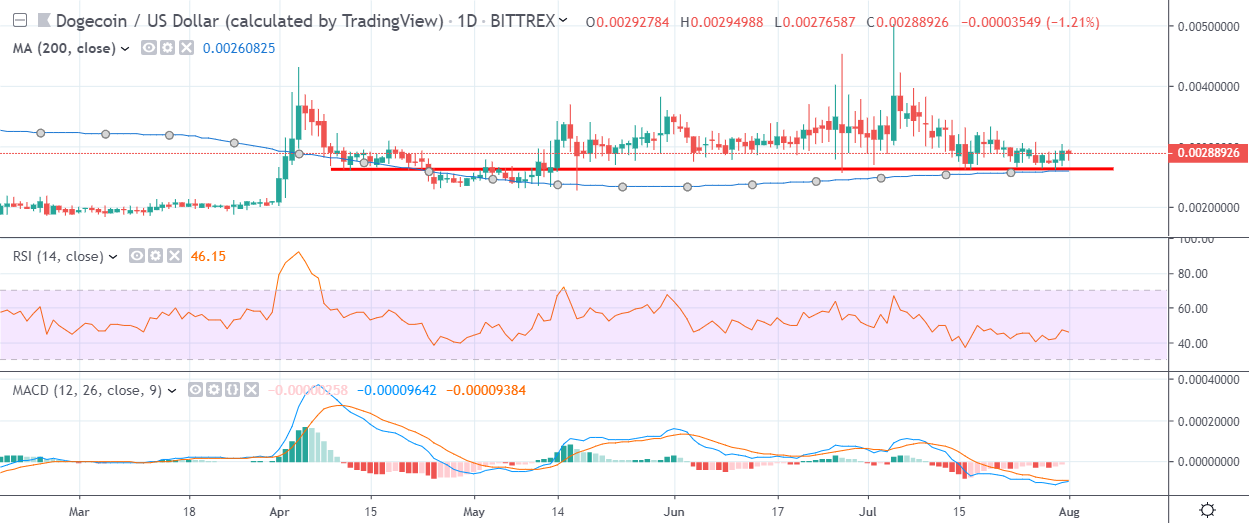
Bytecoin has a bearish short-term trading bias, with the BCN / USD pair creating bearish lower lows and lower highs on the four-hour time frame.
The four-hour time frame is showing that a bearish head and shoulders pattern has been triggered, placing the emphasis on more near-term downside for the BCN / USD pair.
The four-hour time frame shows that technical indicators are turning lower after a brief technical correction.
Pattern Watch
Traders should note that a much larger head and shoulders pattern is also in play across the higher time frames.
Relative Strength Index
The RSI indicator has turned bearish on the four-hour time frame and is now issuing a strong sell signal.
MACD Indicator
The MACD indicator is starting to turn lower on the four-hour time frame, following a brief technical correction.
Bytecoin / USD Medium-term price analysis
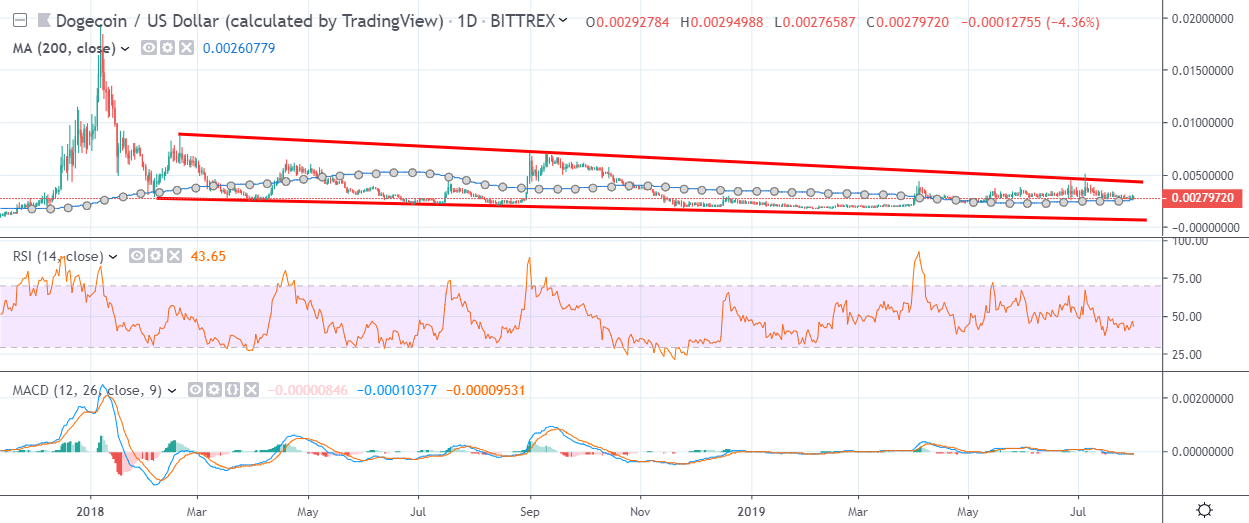
Bytecoin has a bearish medium-term bias, with price now trading below the BCN / USD pair’s 200-day moving average during October last year.
The daily time frame chart is showing that the 50-day moving average is close to crossing over the 200-day moving average, which should be considered a bearish signal.
Pattern Watch
Traders should note that a bearish head and shoulders pattern can also be seen across the daily time frame.
Relative Strength Index
The RSI indicator is bearish on the daily time frame and continues to issue a medium-term sell signal.
MACD Indicator
The MACD indicator on the daily time frame is starting to correct from extreme oversold conditions.
Conclusion
Bytecoin remains weak over the both time horizons, with the triggering of the head and shoulders pattern on the four-hour time frame providing another bearish trading signal.
The daily time frame highlights that the 50-day moving average is close to crossing over the 200-day moving average, signifying a bearish death cross in technical terms.
Check out Bytecoin in our coin guide.