
Cardano Makes New Yearly Highs While Technicals Warn of Potential Correction
Cardano's price is up more more than 50% in the past four days as demand for ADA skyrockets.
Cryptocurrency enthusiasts are paying heightened attention to Cardano after ADA breached new yearly highs. Still, a particular technical indicator points to a retracement before higher highs.
Cardano Breaks New Yearly Highs
Cardano is yet another altcoin following Bitcoin’s 90% bull rally.
The so-called “Ethereum killer” finally moved past a critical resistance barrier and surged over 50%. It went from trading at a low of $0.105 on Nov. 20 to recently reach a new yearly high of $0.158.
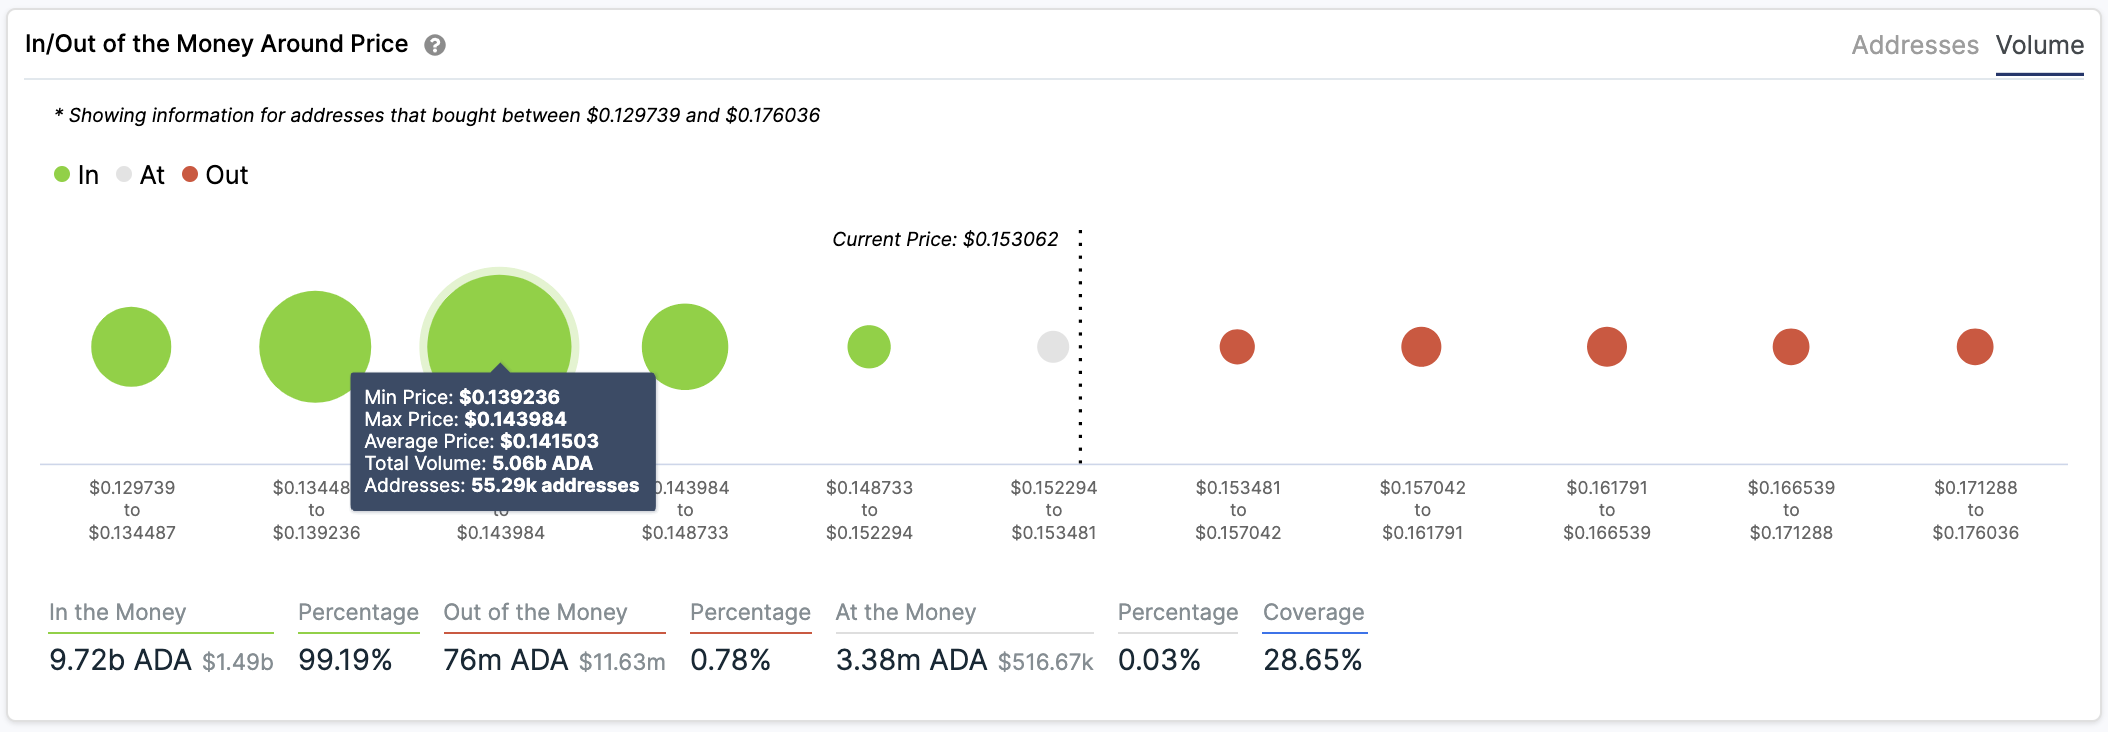
Despite the significant bullish impulse seen in the last few days, IntoTheBlock’s “In/Out of the Money Around Price” (IOMAP) model shows that Cardano has more room rise. Based on this on-chain metric, there is little to no resistance barrier ahead of this altcoin, preventing it from posting further gains.
If buying pressure continues to mount, ADA could rise to $0.20 before finding any potential hurdle.
When looking at Cardano’s network growth, the bullish thesis holds.
Since late October, the number of new daily ADA addresses has steadily increased. Roughly 3,800 addresses were joining the network on a daily basis around Oct. 24.
This number has skyrocketed to nearly 13,000 a day, representing more than a 240% jump.
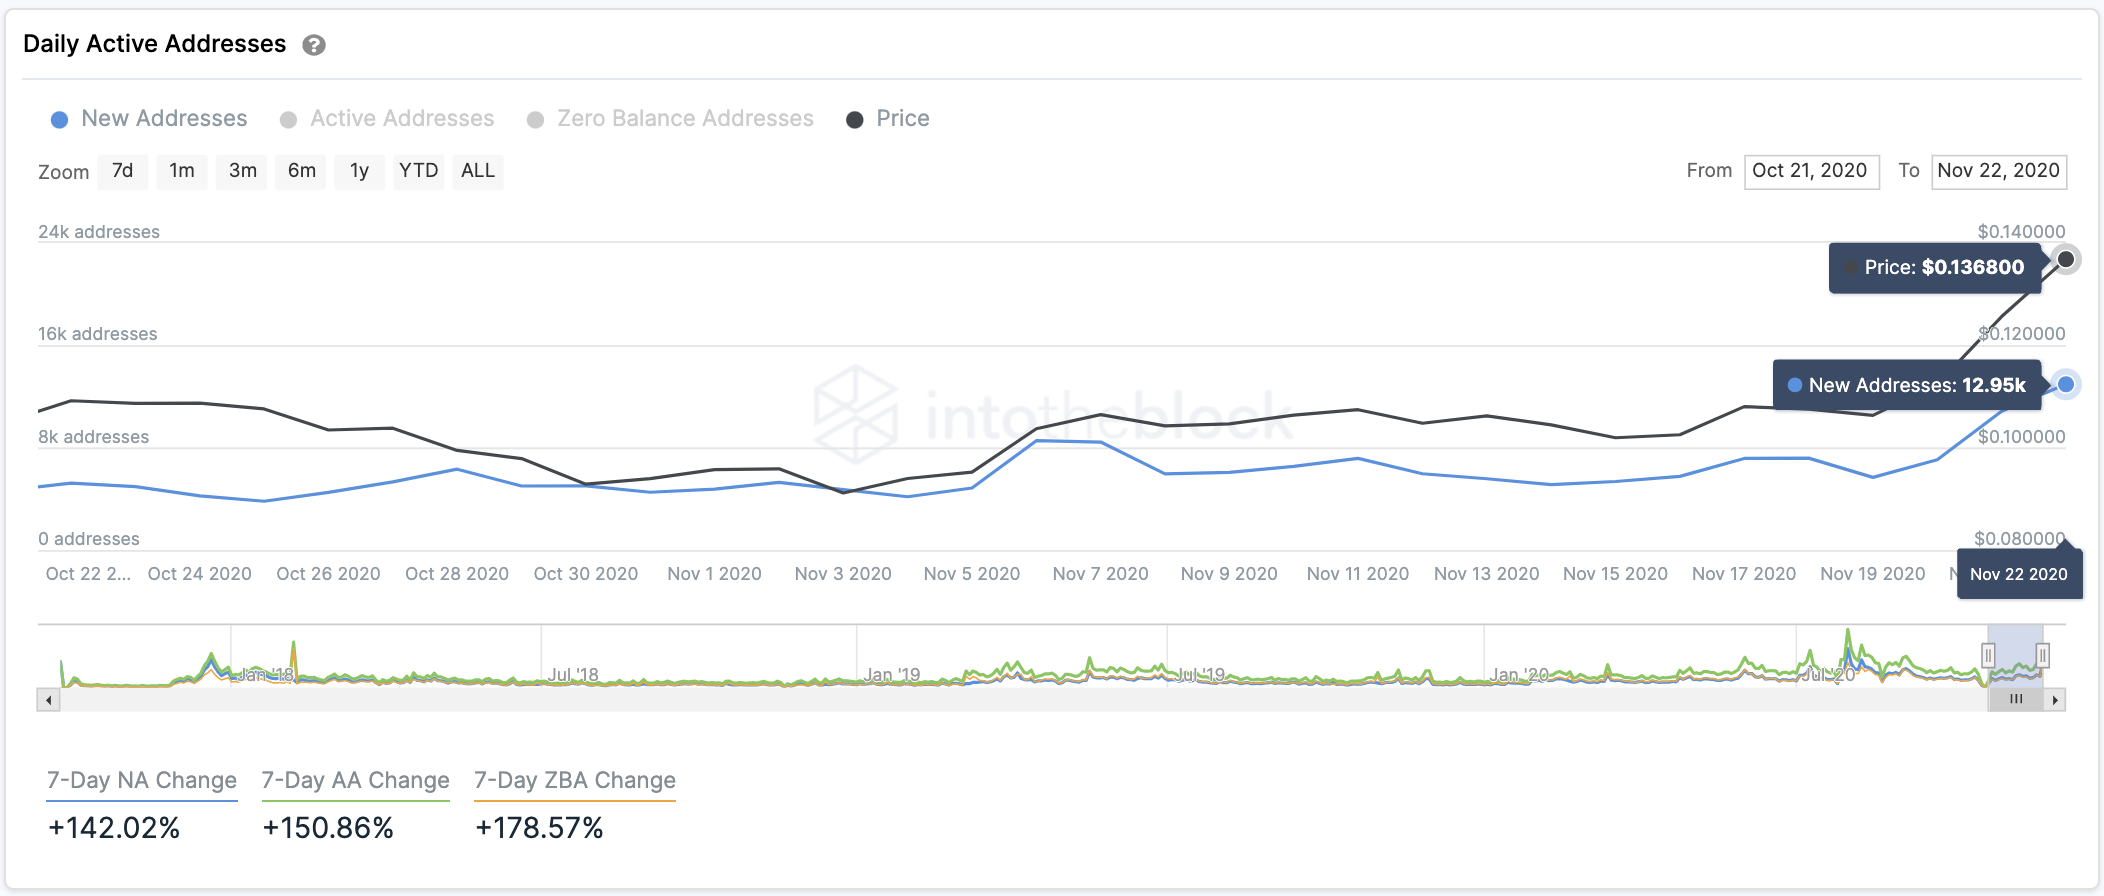
The uptrend in network growth is a green flag for price growth shortly. A sustained increase in network growth is often a leading indicator of appreciating prices. The rise in newly-created addresses tends to affect the regular inflow and outflow of tokens in the network and, thus, liquidity.
Approaching Overbought Territory
Regardless of the optimistic view that Cardano’s on-chain metrics show, the TD sequential indicator warns of a potential correction in the horizon. This technical index is about to present sell signals in the form of green nine candlesticks on ADA’s 12-hour and 4-hour charts.
Although the bearish formations have yet to develop, the near-term future might not look bright for the bulls.
The IOMAP cohorts reveal that Cardano must hold above $0.142 because this is the most significant demand wall underneath it. Here, more than 55,000 addresses had previously purchased over 5 billion ADA.
Such a critical interest area may have the ability to keep falling prices at bay in a correction. Holders within this price range may do anything to keep their positions in the green, including buying more tokens to help Cardano rebound.
But if the spike in downward pressure is significant enough to break through the $0.142 support level, the smart contracts token could plunge to $0.126