Cardano Price Analysis: Bulls Are Getting Ready

Share this article
-
- CARDANO is turning bullish in the short-term with price creating higher highs and lower lows
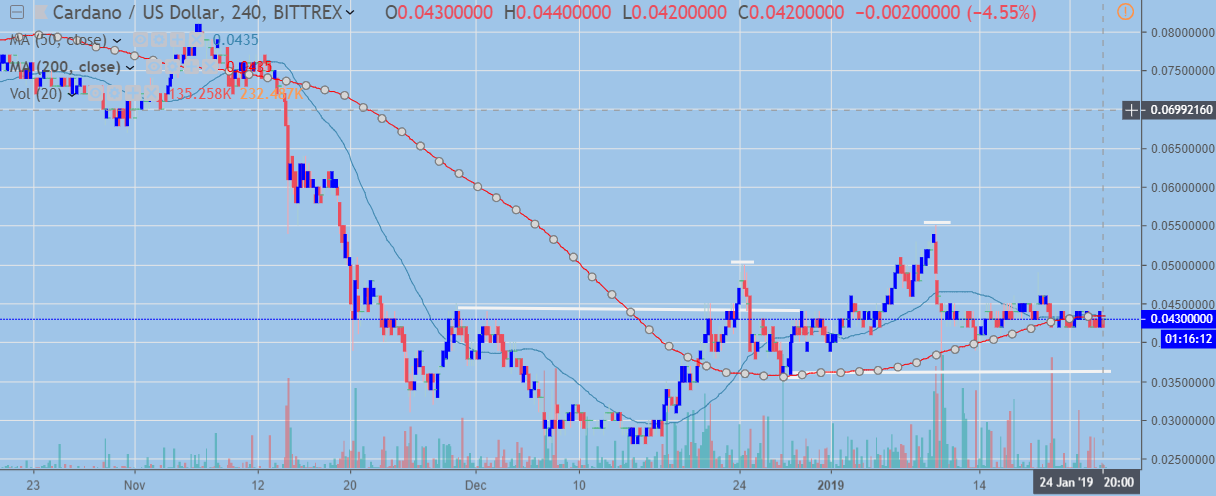
- On the four-hour time frame a bullish inverted head and shoulders pattern is evident
- Medium-term is inconclusive as price trades close to the ADA / USD pair’s 50-day moving average but crucially below its 100-day
ADA / USD Short-term price analysis
In the short-term, Cardano is starting to show bullish signs, with price creating higher highs and lower lows, the pair is currently consolidating above the neckline of a bullish inverted head and shoulders pattern.
Overall a cautious bullish tone is warranted, and further price stabilization may be a good indication that the ADA / USD pair is getting ready to launch higher. This is certainly another cryptocurrency that is at a critical juncture in the short-term and should be on the watchlist of traders who are looking at the crypto buy-side.
Pattern Watch
Aside from the bullish inverted head and shoulder pattern, a sharp decline from current levels would effectively see the formation of a bearish head and shoulders pattern across the lower time frames.
A bearish drop would negate the bullish short-term view and a further decline towards the all-time low for Cardano would seem the most likely play.

Key Moving Averages
Price is currently trading around both the 50 and 200-period moving averages on the four-hour time frames, highlighting that a decisive move ahead may be upon us.
Volumes
ADA / USD trading volumes had been lacking during the early 2019 bull move higher, indicating that any strong moves higher or lower on light volume may be worth fading.
ADA / USD Medium-term price analysis
Cardano’s medium-term prospects appeared more promising at the start of the year, although the early 2019 rally has fizzled out. The ADA / USD pair does show some potential to rally in the medium-term, if bulls can break the current 2019 high and crucially rally above its 100-day moving average.
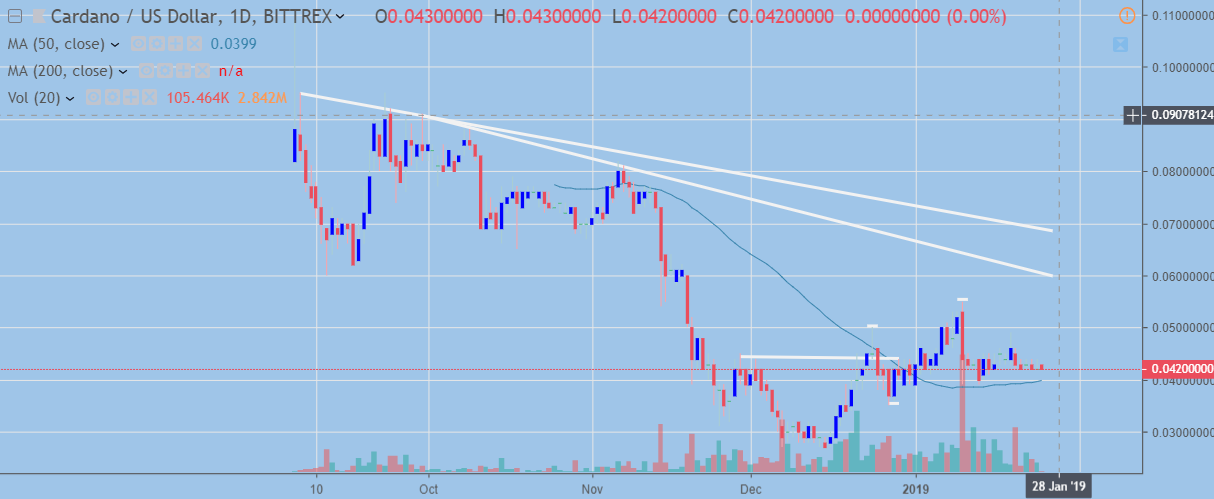
The falling trendlines seen on the daily chart, at the 0.60 and 0.70 levels offer buyers a solid upside target if the 2019 high is broken with conviction.
A further advance above the trendline would really start to ignite the up move, with the former swing-high just above the 0.80 level a very obvious target ADA / USD buyers.
 ADA / USD Daily Chart (Source: TradingView)
Pattern Watch
In sync with the lower time frames, the daily time frame is showing ADA / USD trading above a bullish inverse head and shoulders and price still creating bullish higher highs and lower lows.
Key Moving Averages
Price currently trades within the 50-day and 100-day moving averages, a breakout should be watched for next overall medium-term theme to emerge.
Volume
The only real worries for bulls would be the volume indicator, which appears to show the largest ever one-day selling volume occurring during the ADA / USD pair’s heavy decline from its 2019 trading high, on January 10th.
Decentral Media, Inc., the publisher of Crypto Briefing, is not an investment advisor and does not offer or provide investment advice or other financial advice. Nothing on this website constitutes, or should be relied on as, investment advice or financial advice of any kind. Specifically, none of the information on this website constitutes, or should be relied on as, a suggestion, offer, or other solicitation to engage in, or refrain from engaging in, any purchase, sale, or any other any investment-related activity with respect to any transaction. You should never make an investment decision on an investment based solely on the information on our website, and you should never interpret or otherwise rely on any of the information on this website as investment advice. We strongly recommend that you consult a licensed investment advisor or other qualified financial professional if you are seeking investment advice on an investment.
Share this article
