ADA / USD Price Analysis: Corrective Pullback
Cardano is still technically bullish due to trading above its average, but most indicators are bearish.

Share this article
- Cardano has a bullish short-term bias, with the cryptocurrency still trading well above its 200-period moving average
- The daily time frame chart is showing a large inverted head and shoulders pattern
- Bullish MACD price divergence remains present on the daily time frame chart from May last year
Cardano / USD Short-term price analysis
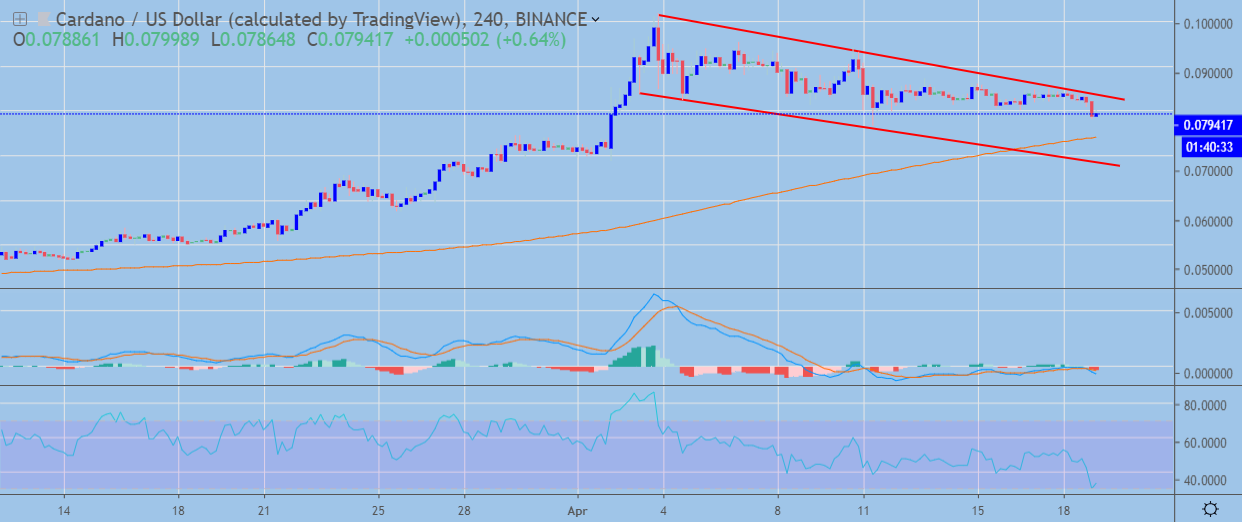
Cardano maintains a bullish short-term trading bias, with the cryptocurrency still trading above its 200-period moving average despite a technical correction lower from the best levels of 2019.
The four-hour time frame is showing that the ADA / USD pair is trading inside a bullish flag pattern, with buyers so far unable to move price above trendline resistance.
Technical indicators have turned bearish following the latest correction in the ADA / USD pair.
 ADA / USD H4 Chart by TradingView
Pattern Watch
Traders should note that a bearish double-top pattern is also in play on the four-hour time horizon.
Relative Strength Index
The RSI indicator is also bearish on the four-hour time frame, although it has reached oversold territory.
MACD Indicator
The MACD indicator on the four-hour time frame has turned bearish and is currently issuing a strong sell signal.
Cardano / USD Medium-term price analysis
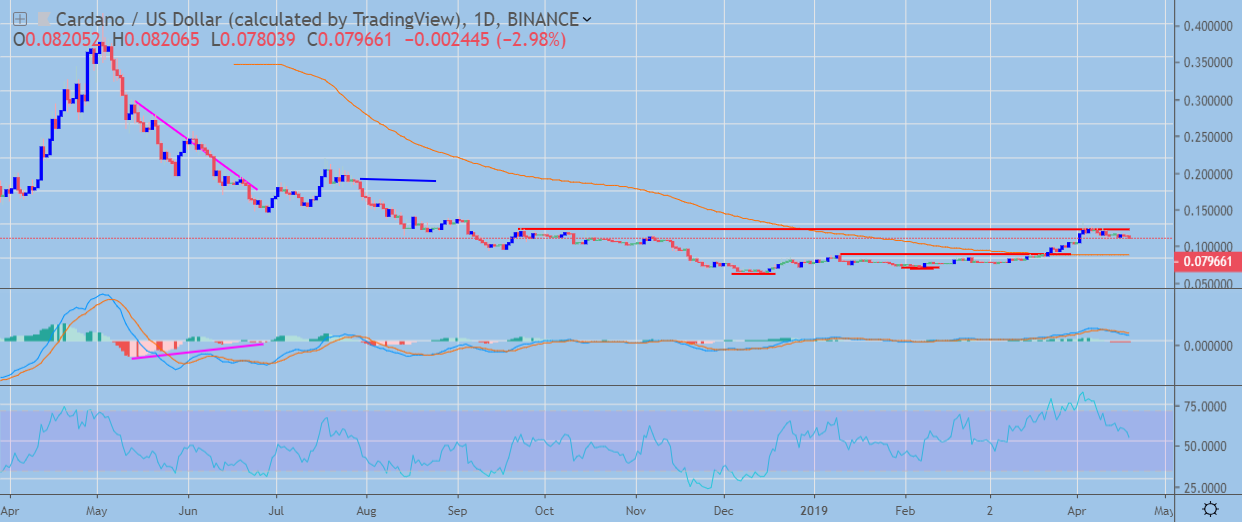
Cardano still has a bullish medium-term trading outlook, with the cryptocurrency trading well above its trend defining 200-day moving average.
The daily time frame shows that an even larger inverted head and shoulders pattern has now been created, with the ADA / USD pair consolidating close to the neckline of the bullish pattern.
Technical indicators on the daily time frame are bearish, although bullish MACD price divergence is still evident from May of last year.

Pattern Watch
Traders should note that the large inverted head and shoulders patterns upside projection would take the ADA / USD pair towards levels not seen since July 30th, 2018.
Relative Strength Index
The RSI indicator is also bearish on the daily time frame and shows scope for further downside.
MACD Indicator
The MACD indicator on the daily time frame has turned bearish and is continuing to issue a strong sell signal.
Conclusion
Cardano is starting to pullback after staging an impressive upside rally, with both the four-hour and daily time frames indicating that an even deeper correction may occur in the near-term.
The bullish inverted head and shoulders pattern and MACD price divergence on the daily time frame underscore that the ADA / USD pair could still trade significantly higher over the medium-term.
Check out our coin guide introduction to the Cardano project.
A detailed analysis of the project is available in our DARE.
Share this article
