
Chainlink Carnage Likely to Continue
Chainlink was hit particularly hard by the crypto market crash. Now, it seems like its due for a further fall.
After brutally losing half its value, metrics show that the carnage for Chainlink is not over. Several indicators point toward LINK falling another 50%.
Will Chainlink Fall Even Further?
Among the top 20, Chainlink suffered the most during the recent market downturn. Its price plummeted over 70% after peaking at $5 at the beginning of the month. Even though multiple technical indicators forecasted the pessimistic outlook, it was unreasonable to predict that LINK would have gone as low as $1.5.
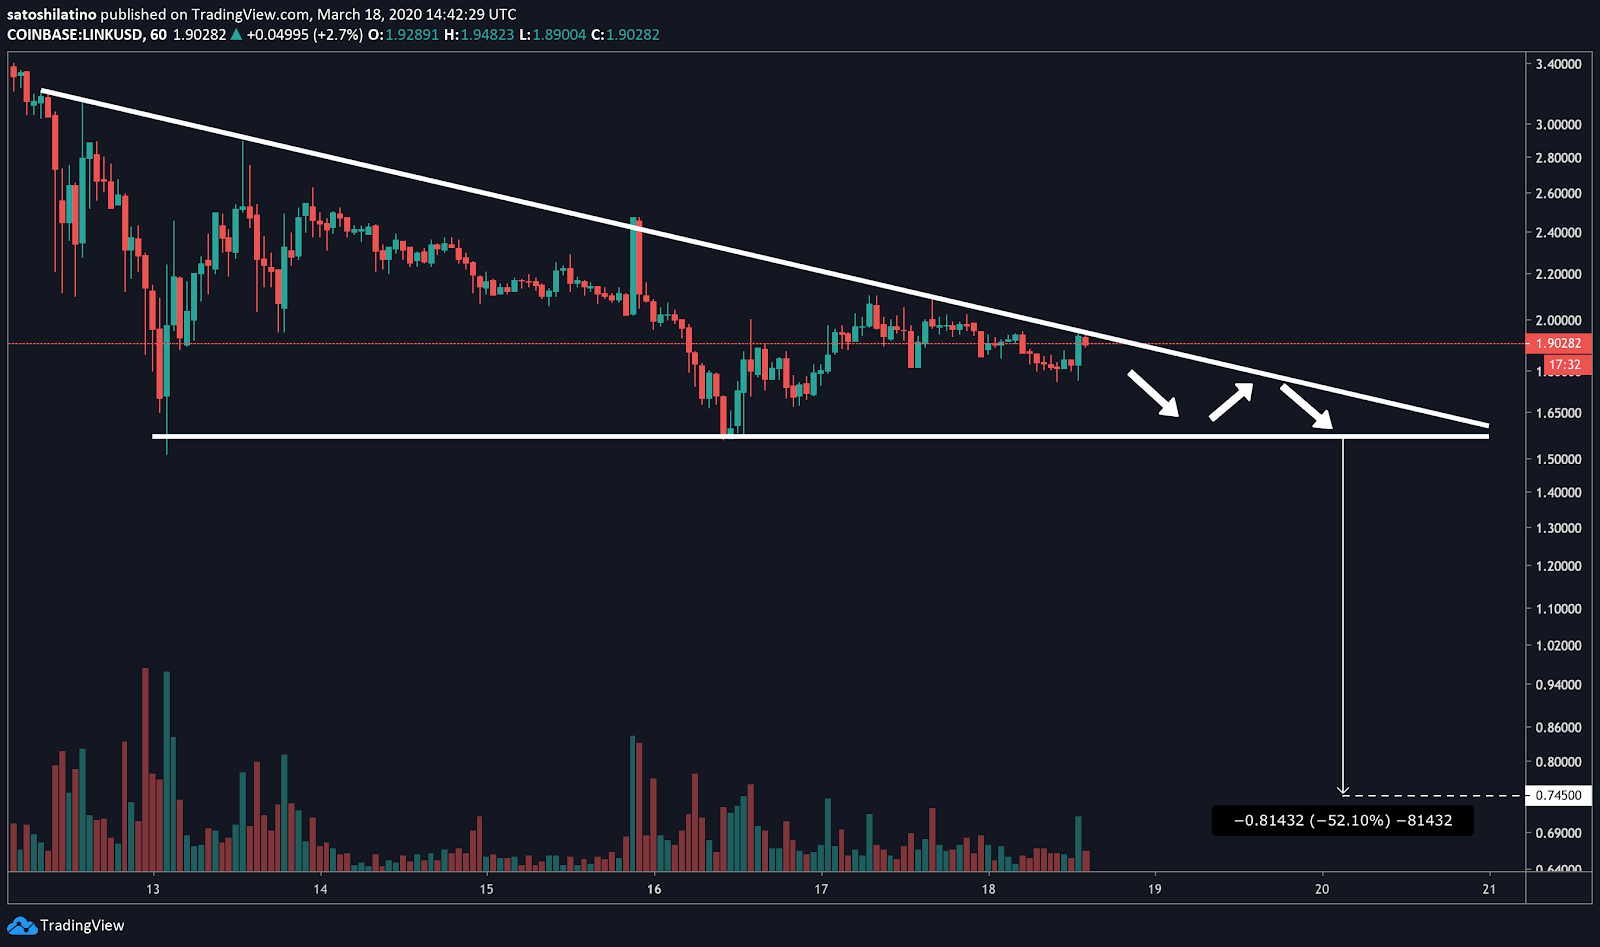
Now, a technical pattern indicates that the carnage may not be over. Based on the 1-hour chart, a descending triangle appears to be developing as a direct consequence of LINK’s price action. A trendline connects the series of lower highs while a horizontal support line can be drawn around the swing lows.
The bearish formation suggests that breaking below the $1.56 support level could be followed by a spike in the selling pressure behind Chainlink. If validated, the downward impulse could see LINK plunge 52%, taking its price to $0.75.
This target is determined by measuring the height of the descending triangle at its thickest point and adding that distance to the breakout point.
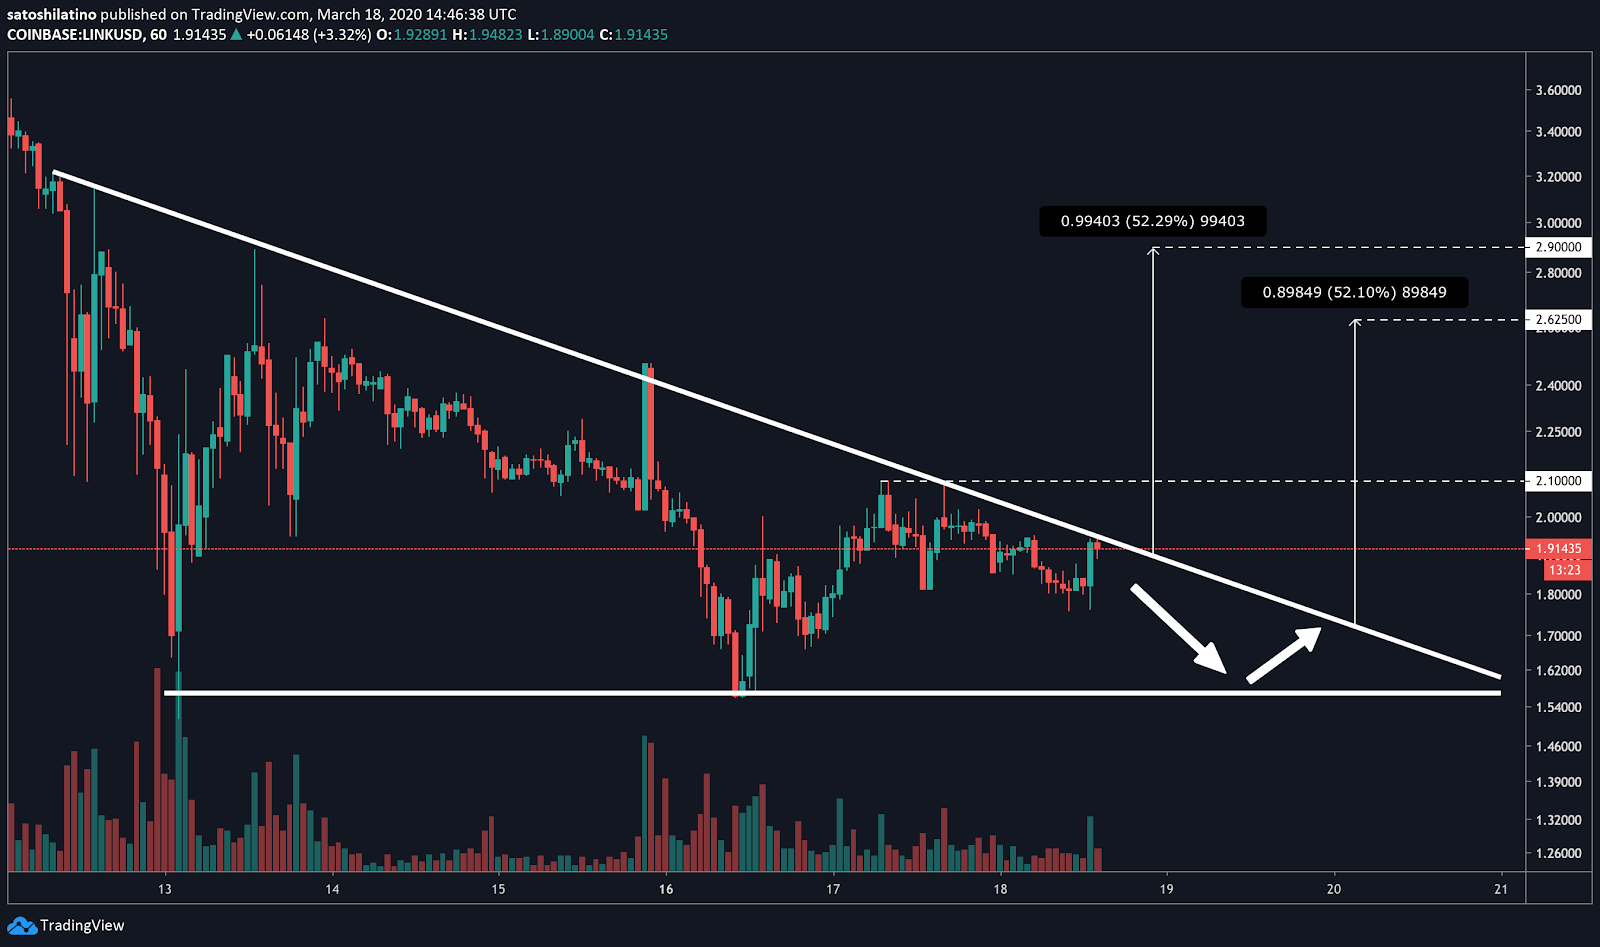
Although descending triangles are generally seen as bearish continuation patterns, they can also form as reversal patterns to a downtrend.
For this to happen, Chainlink would have to break above the descending trendline and make a higher high. The bullish momentum would increase the odds for a 52% upswing that takes this cryptocurrency to $2.63 or $2.90. The upside targets depend on the timing in which the resistance cluster is broken.
It is worth mentioning that closing above the resistance ahead would not be as easy. IntoTheBlock’s “In/Out of the Money Around Current Price” statistical model estimates that there are over 2,300 addresses that bough 16 million LINK between $1.88 and $1.92. Additionally, nearly 1,500 addresses bought another 9.8 million LINK at an average price of $2.
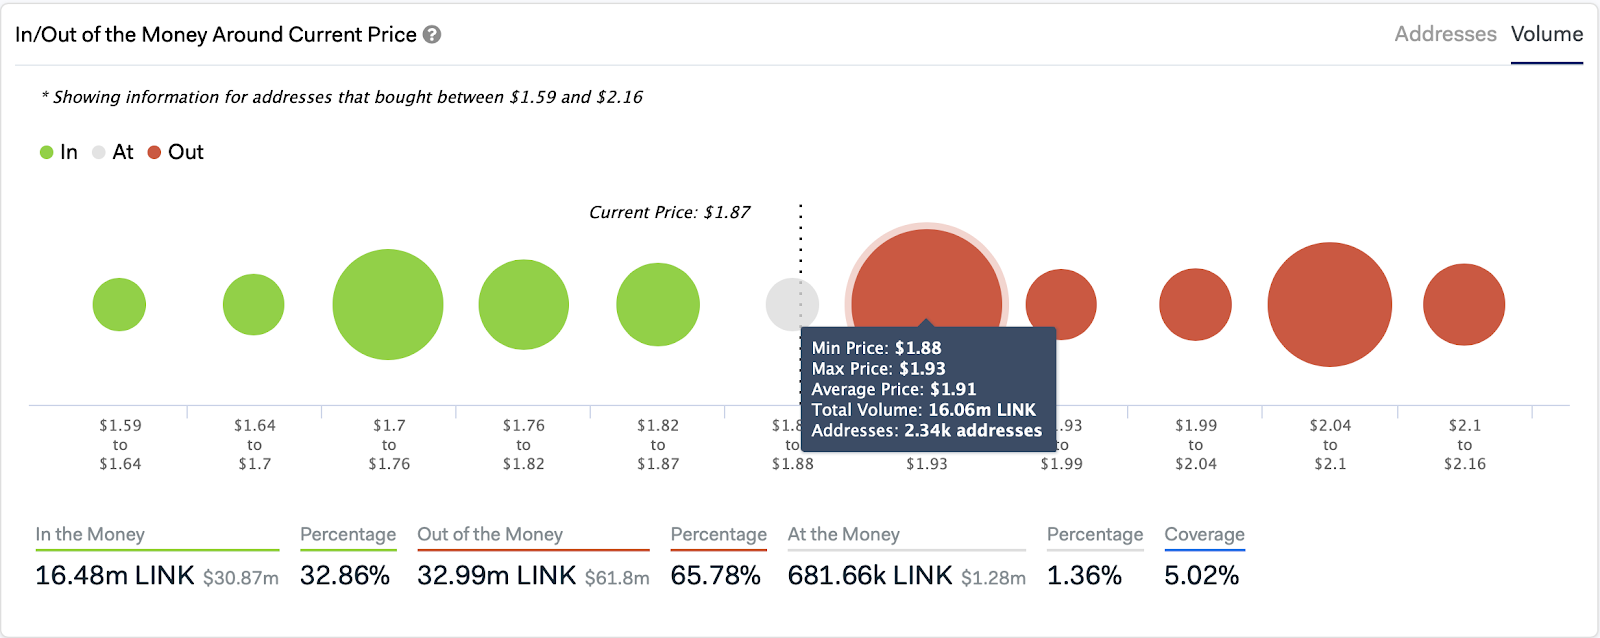
This significant supply barrier could prevent Chainlink from reaching the bullish target presented by the descending triangle formation.
Moving Forward
The Crypto Fear and Greed Index is sensing “extreme fear.” Even gold took a hit during the market meltdown. Much riskier Bitcoin, as a result, will continue to plummet as long as the market craves cash.
However, this could be a chance to be “greedy when others are fearful” and load up on stock and crypto over the course of the market correction.