Chainlink Price Analysis: Breaking Down
A breakout is looming.

Share this article
- Chainlink has a bearish short-term and medium-term trading outlook
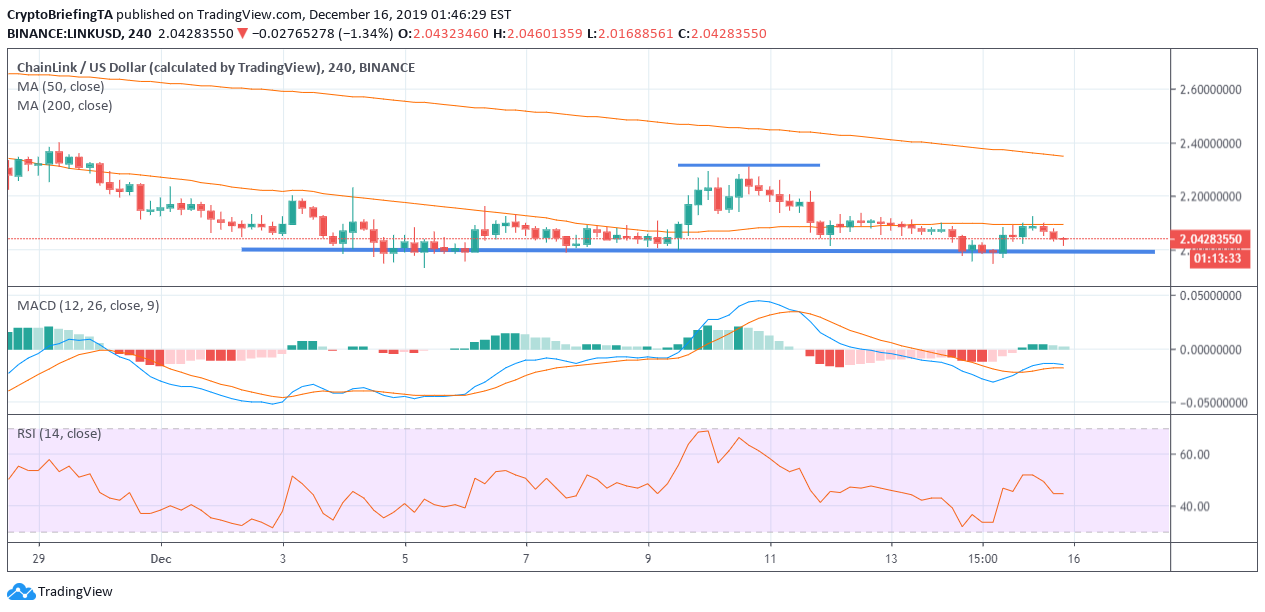
- The four-hour time frame shows that a bearish head and shoulders pattern has formed
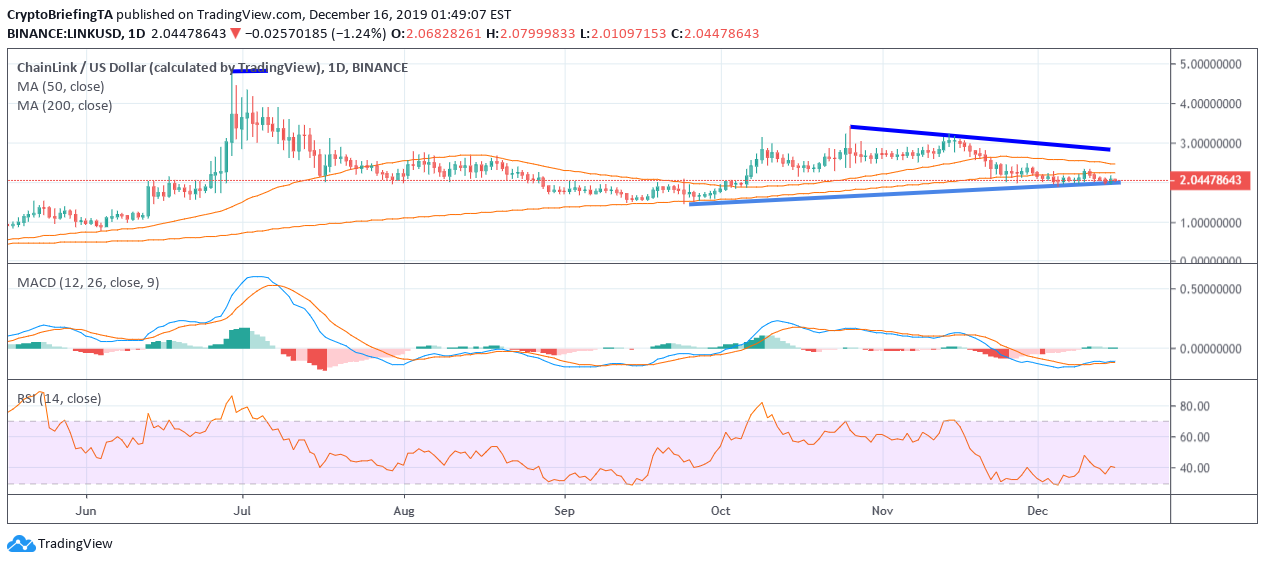
- The daily time frame continues to show the price trapped within a wedge pattern
Chainlink is under increasing downside pressure, with the popular cryptocurrency on the cusp of a short-term bearish breakout towards the $1.70 support level.
The LINK/USD pair has been drifting lower since mid-November, following a downside range breakout and continued pressure from the overall negative crypto market trend.
The four-hour time frame shows that a head and shoulders pattern has taken shape, with its overall downside target located around the $1.70 level.
A break under the $2.00 support should increase technical selling towards the LINK/USD pair, placing the $1.70 level firmly in focus for short-term sellers.
The daily time frame shows that a wedge pattern has been developing over the last few weeks. The price is currently testing its lower end.
The lower time frames and overall bearish trend indicate that the wedge breakout is likely to be to the downside. Watch out for this scenario to occur if the $2.00 level is breached with conviction.
Buyers need to rally price above the $2.30 level to change the overall trend in the LINK/USD. This is still very achievable if a broader market rally or positive fundamental news surrounding Chainlink arises.
The Relative Strength Index on the daily and time frame is bearish and still shows considerable downside potential before becoming oversold.
Upside Potential
The four-hour time frame shows that key technical resistance is now located at the $2.10 and $2.30 levels.
Key technical resistance over the medium-term is located at the $2.48 and $3.00 levels.
Downside Potential
The four-hour time frame is showing that the LINK/USD pair has strong medium-term technical support around the $2.00 and $1.70 levels.
Summary
Technical analysis suggests that the LINK/USD pair could be preparing to test towards the $1.70.
Watch for a breakout under the $2.00 level for confirmation of the impending bearish move.
Share this article
