Chainlink Price Analysis LINK / USD: Bucking The Trend
LINK remains bullish as market falls steeper.

Share this article
- Chainlink is bullish over both the short and the medium-term
- The four-hour time is showing that a bullish inverted head and shoulders pattern has formed
- The daily time frame is showing that a large inverted head and shoulders patterns with double-digit potential could start to form
Chainlink is holding onto recent trading gains as the cryptocurrency continues to buck the bearish trend currently sweeping through the broader digital currency market.
The LINK / USD pair is one of the few digital assets inside the top fifty by market cap that is still technically bullish over both the short and the medium-term.
The cryptocurrency trades around fifty percent higher since the start of the month, and trades a whopping seven-hundred percent higher since the beginning of 2019.
Going forward, a series of bullish inverted head and patterns appear to be predicting that the LINK / USD pair is likely to rally back towards its 2019 trading peak.
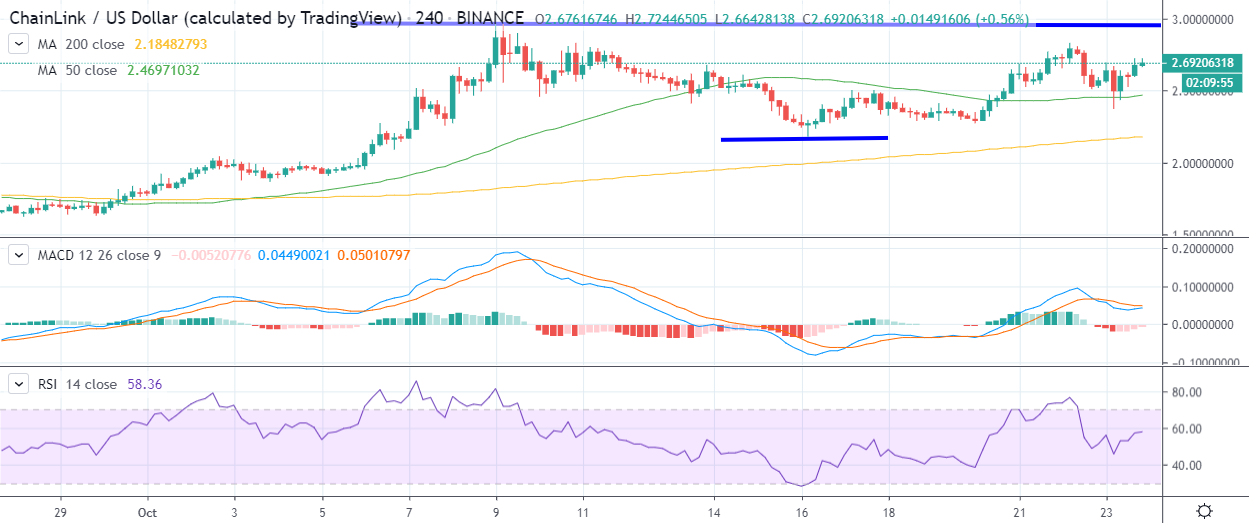
The four-hour time frame is highlighting that the LINK / USD pair could gain a further thirty percent in value if buyers move price above the $3.00 resistance level.
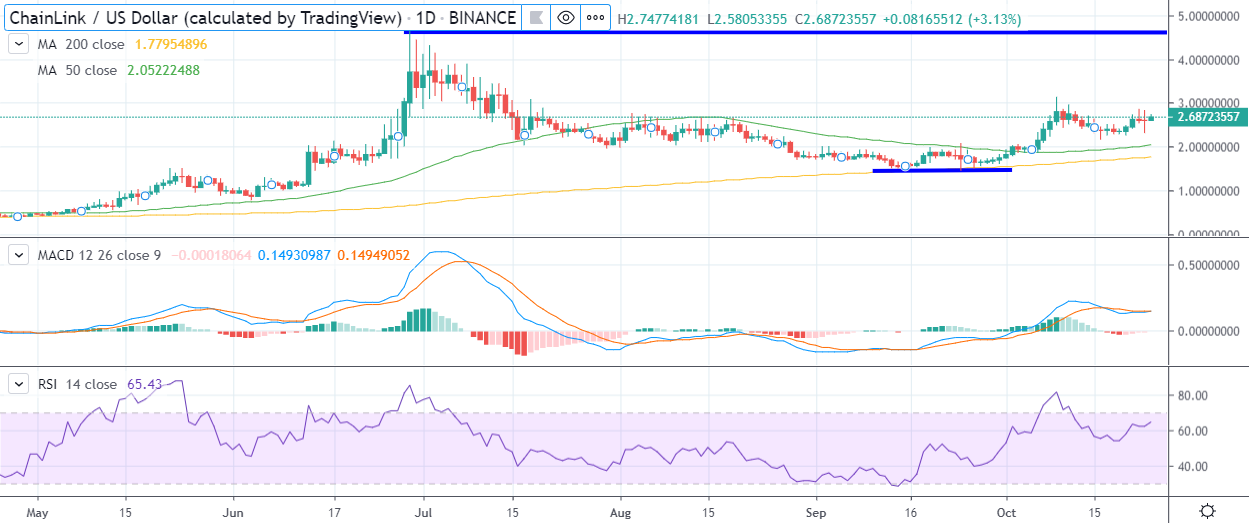
The daily time frame highlights that a much larger inverted head and shoulders pattern could form, with the neckline of the bullish pattern located around the $4.60 resistance level.
The overall upside projection of the pattern would take the LINK / USD pair towards the $8.00 level. It is also noteworthy that the daily RSI indicator is far from being oversold and continues to point to further medium-term gains ahead.
Sentiment
According to the latest sentiment data from TheTIE.io, the short-term sentiment towards Chainlink is neutral, at 56.00 %, while the overall long-term sentiment towards the cryptocurrency is bullish, at 66.00%.
Upside Potential
The four-hour time frame highlights that the LINK / USD bulls need to move price above the $3.00 resistance level to trigger a bullish inverted head and shoulders pattern with a thirty percent upside projection.
The daily time frame shows that if bulls rally price towards the $4.60 level a much larger inverted head and shoulders pattern with a $3.50 upside projection will form.
Downside Potential
The four-hour time frame shows that a move below the $2.45 level would be bearish for the LINK / USD pair in the short-term. The LINK / USD will lose its short-term bullish status if price trades below the $2.15 level.
The daily time frame is currently showing that sellers need to move price below the $1.70 support level to negate the LINK / USD pair’s medium-term bullish bias.
Summary
Chainlink has retained its short and medium-term bullish bias, despite the broader cryptocurrency market coming back under heavy downside pressure.
According to the upside projection of the bullish pattern on the four-hour time frame, a sustained breakout above the $3.00 level could propel the LINK / USD pair towards the $4.60 level.
Find out more about Chainlink in our coin guide.
Share this article
