
Chainlink Screams Sell Despite New Highs
Chainlink continues to rise to new all-time highs, but the bearish signals around it raise questions about the sustainability of the uptrend.
Decentralized oracles token Chainlink stole the crypto spotlight after outperforming most digital assets this quarter. Despite new all-time highs, different on-chain and technical metrics show that LINK is ready to retrace.
LINK’s Social Engagement Metrics Explode
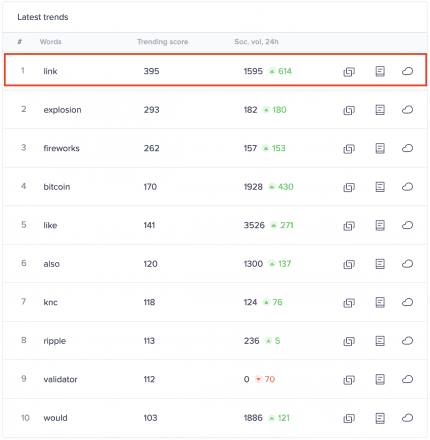
Chainlink’s recent upswing turned heads, especially considering that many traders thought LINK was already overbought. Data reveals that the number of LINK-related mentions on different social media networks surged dramatically. The numbers suggest the market has entered FOMO around Chainlink.
The rising chatter around the decentralized oracles token allowed it to move to the number one spot on Santiment’s Emerging Trends list. Nonetheless, the high level of notoriety is not necessarily a good sign, according to Dino Ibisbegovic, head of content and SEO at Santiment.
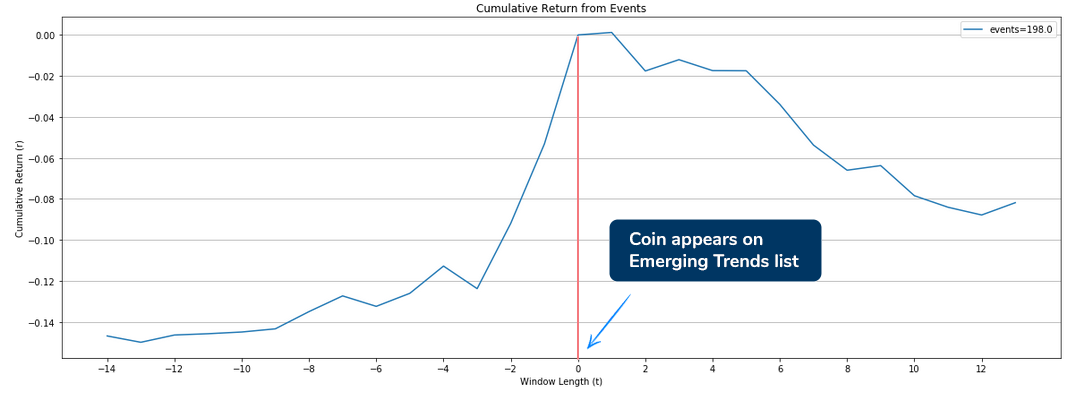
The analyst maintains that when the crowd pays increased attention to a cryptocurrency in line with pumping prices, then that movement is usually followed by a steep correction.
“Within the next 12 days after a coin claims a top 3 position on our list of Emerging Trends, its price drops by an average of 8.2 percent. Based on our study, once the increased crowd attention subsides (which usually happens in a matter of hours/days), a short-term price correction—or consolidation—is often a likely outcome,” said Ibisbegovic.
Indeed, LINK’s uptrend appears to have reached exhaustion after investors became overwhelmingly bullish about its price action. Since the peak, this cryptocurrency is down nearly 3.7%, and a widely known technical index estimates that it could fall further.
Sell Signals Across the Board
The TD Sequential indicator supports the thesis that Chainlink is bound for a steep correction. This technical index presented sell signals in the form of green nine candlesticks on LINK’s 1-week, 1-day, and 12-hour charts. Although the bearish formation has yet to be formed on the daily chart, the near-term future does not look good for the bulls.
A glimpse at the decentralized oracles token’s weekly chart reveals that the TD setup has been incredibly accurate at anticipating local tops on this altcoin’s trend. The five sell signals that this indicator has presented since 2018 were all validated, resulting in significant retracements.
Therefore, the current pessimistic forecast must be taken seriously even though substantial price discovery is still happening around Chainlink.
Chainlink Still has Stiff Price Support
In the event of a correction, IntoTheBlock’s “Global In/Out of the Money” (GIOM) model reveals there is a crucial supply wall underneath this token that could hold falling prices at bay. Based on this on-chain metric, roughly 27,000 addresses had previously purchased nearly 30 million LINK between $7.6 and $9.7.
Such a considerable area of interest may have the ability to absorb some of the selling pressure. Holders within this price range would likely try to remain profitable in their long positions. They may even buy more tokens to avoid seeing their investments go into the red.
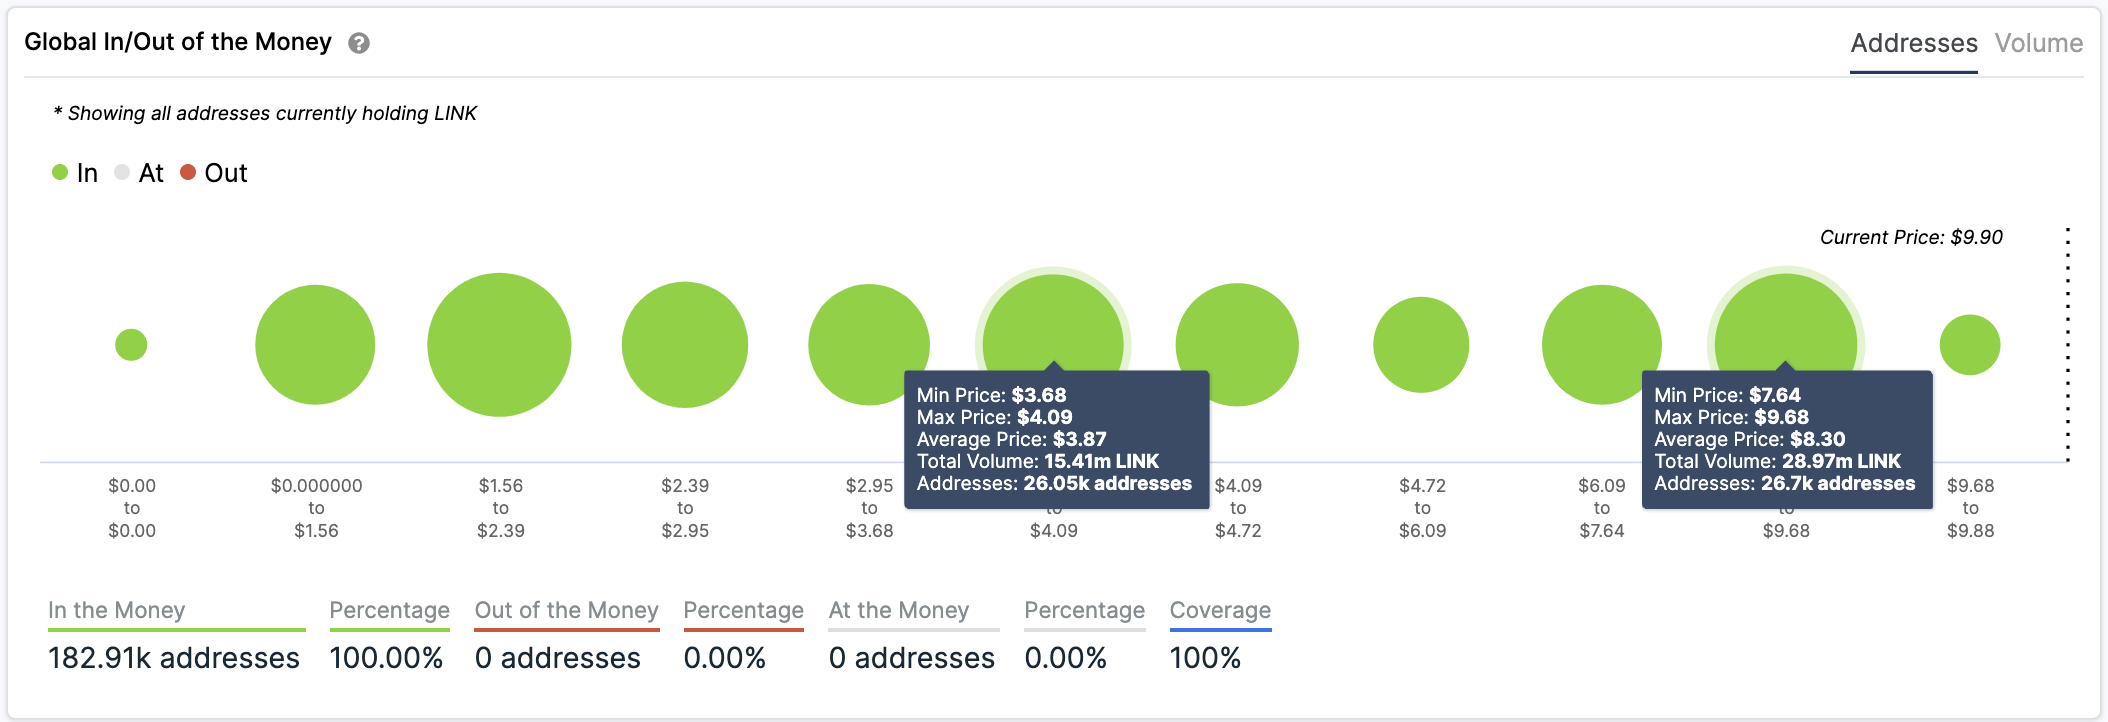
However, if the selling pressure behind Chainlink is significant enough to push prices below this critical support level, then the outcome could be catastrophic. The GIOM cohorts show that the next considerable support barrier lies between $3.7 and $4. Here, over 26,000 addresses are holding roughly 15.5 million LINK.
The Chainlink Network Is Shrinking
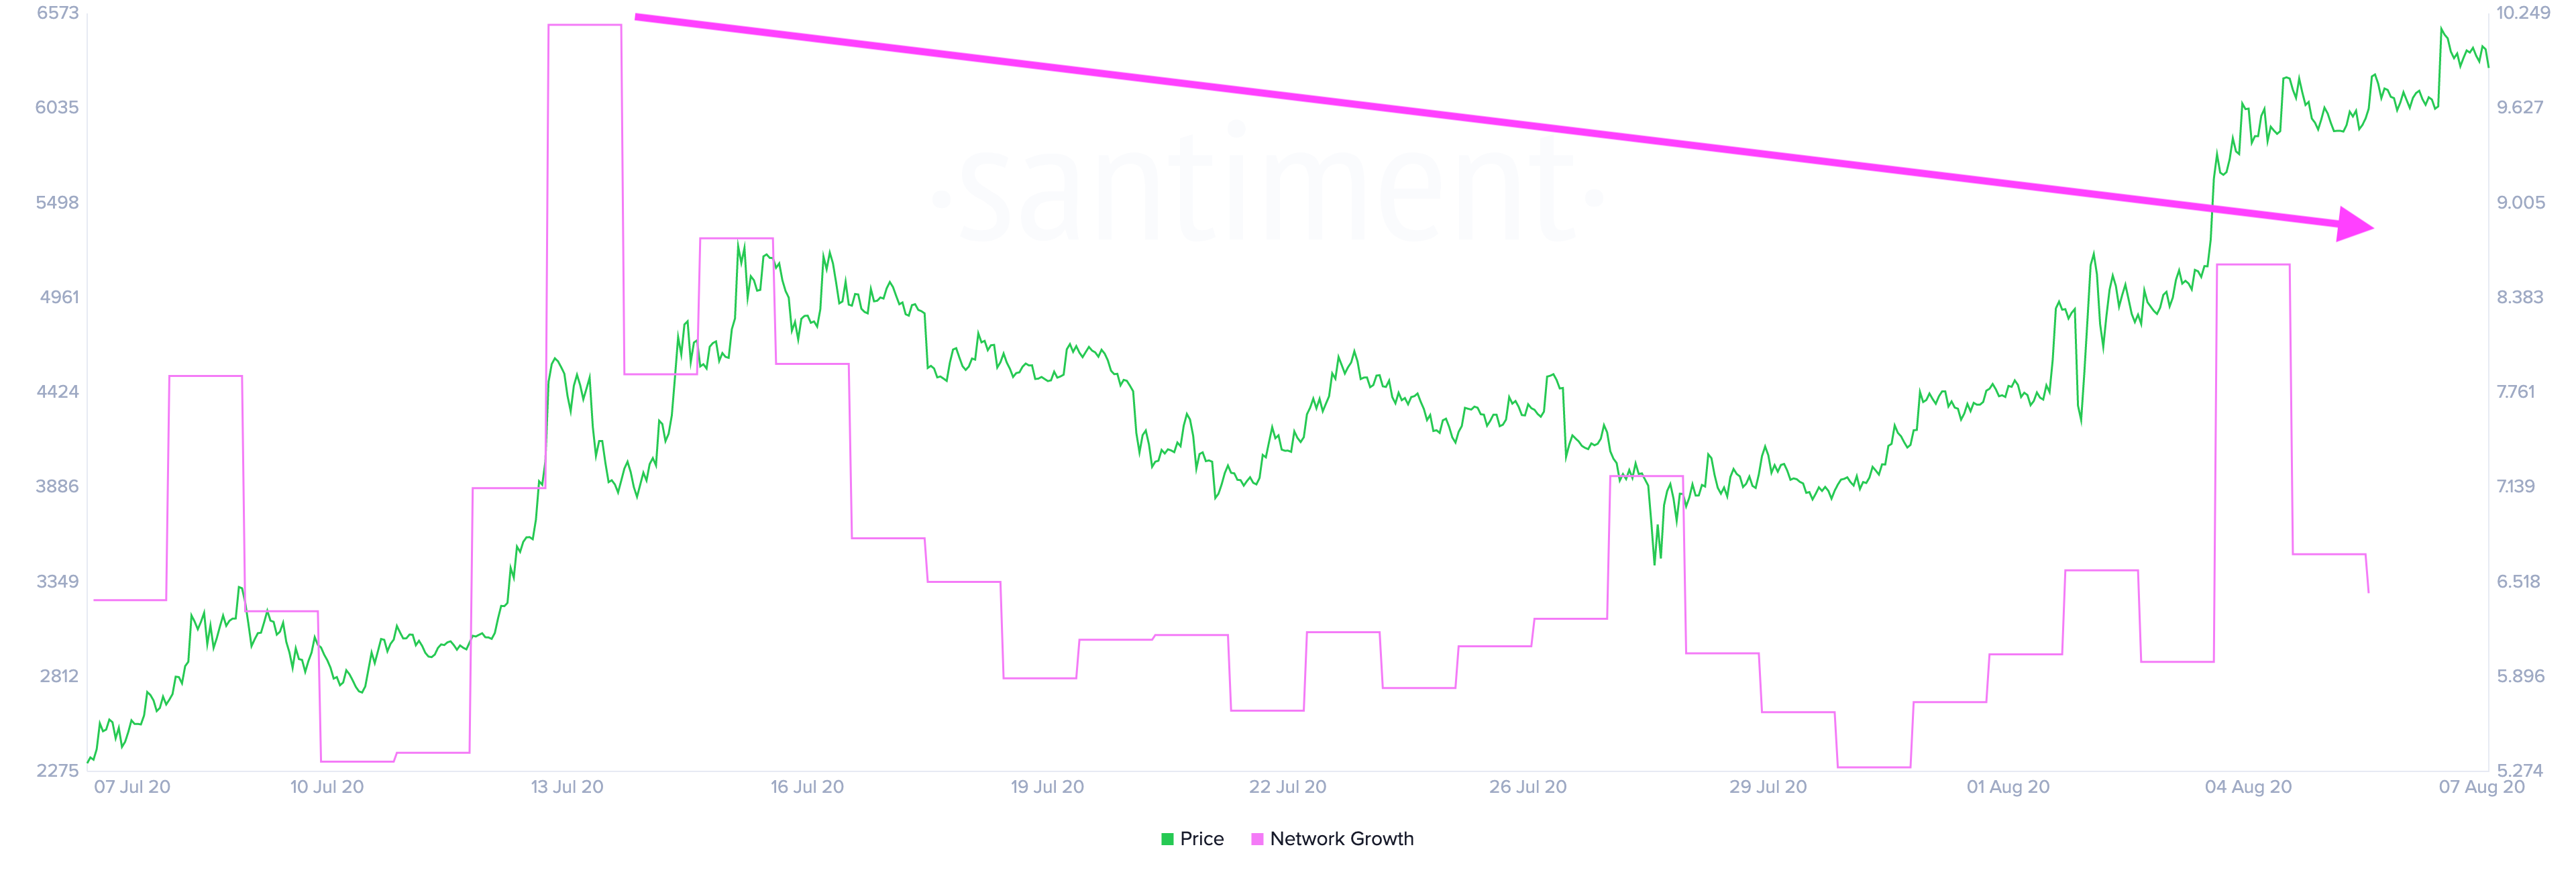
Some of the most prominent analysts in the industry argue that since Chainlink is still in price discovery mode. As such, the bullish outlook cannot be taken out of the question. Still, there is another crucial fundamental metric that indicates trouble. The number of new daily addresses joining the network has been declining while prices have been trending up.
This sort of bearish divergence between prices and network growth can be considered an extremely bearish signal, according to Brian Quinlivan, marketing and social media director at Santiment.
Quinlivan maintains that network growth is “one of the most accurate price foreshadowers.” The increase in user adoption over time can help observers understand the health and well being of any given cryptocurrency.
“Generally, a rising network growth leads to a rising price of any project over time, in most cases. On the flip side, declining network growth for a long enough stretch can usually indicate a future slumping price with the lack of newly created addresses constantly in-flowing the coin or token,” said Quinlivan.
Given the bearish signals previously mentioned and the rate at which Chainlink’s network growth is declining, investors must stay cautious. If sell orders begin to pile up, LINK would likely be bound for a wild ride down.