
Chainlink Suffers Major Downturn, Data Shows More Pain for LINK Ahead
Chainlink seems to have topped at a new all-time high of $20.3. Now, LINK could suffer a significant correction before the uptrend resumes.
Chainlink’s LINK is recuperating after a meteoric bull run pushed the token to nearly $20. Even though prices are down over 11% since the all-time high, multiple technical indexes predict further damage.
Chainlink Whales Offloading LINK on the Market
Chainlink has been on a rampage. Its native token, LINK, saw its price surge by more than 160% since the beginning of August, invalidating all the bearish signals that multiple technical indicators presented.
Such a significant bull rally allowed the decentralized oracles token to provide a year-to-date return of nearly 840%, as of today.
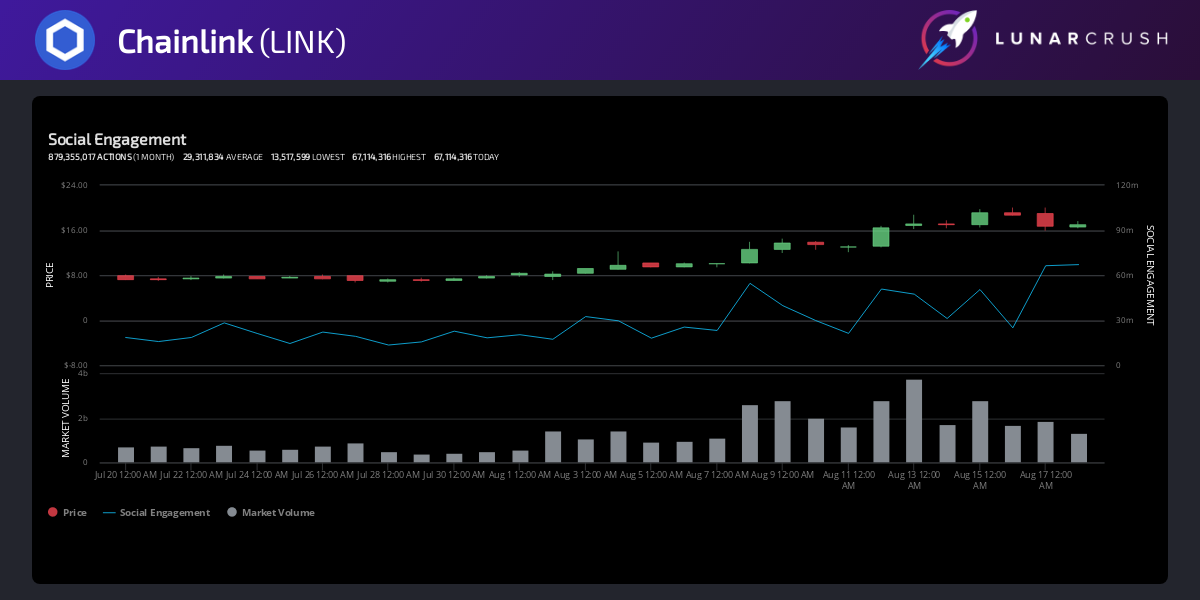
LINK speculation is still rampant despite the massive gains already posted.
Data from LunarCRUSH reveals that over the past 24 hours, more than 65 million LINK-related mentions have been registered throughout different social media networks. More importantly, roughly 68% of all the social interactions have been bullish about this altcoin.
While retail investors seemingly grow euphoric about LINK’s sudden price increase, large whales have been periodically offloading their bags. Data also indicates that large LINK addresses have been doing this long before the all-time high.
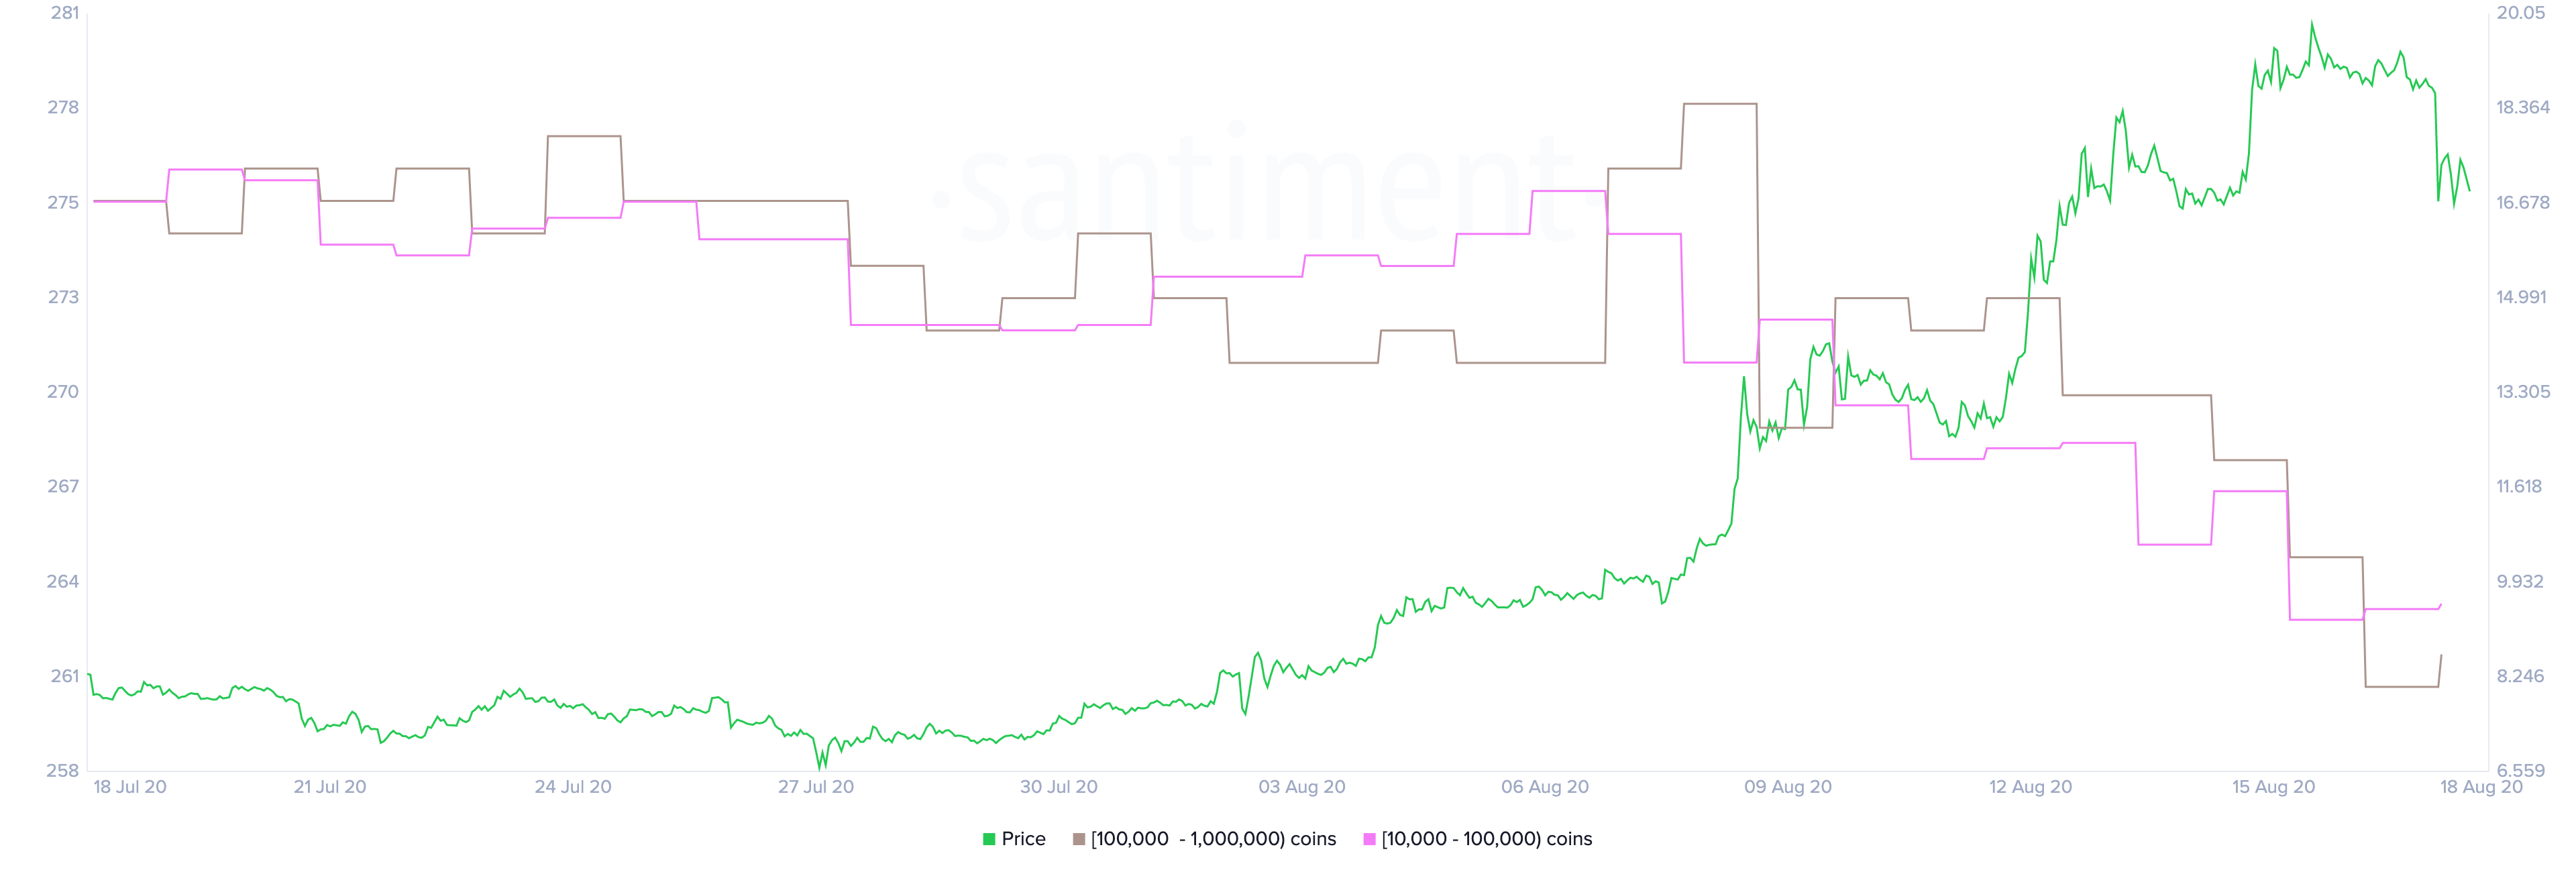
Santiment’s holder distribution chart shows that some of the biggest whales on the network have been offloading their bags on the market since Aug. 8.
Since then, the number of addresses holding 100,000 to 10 million LINK is on a steady decline. Approximately 64 whales have left the network, representing a 2% decline in a short period.
The increasing selling pressure by these large whales is wearing Chainlink down. The price of this token dropped more than 18% since the peak, and multiple technical indexes suggest it is bound for further losses.
On the Brink of a Steep Correction
The TD sequential indicator has proven to be essential in determining Chainlink’s local tops.
Indeed, this technical index has been able to predict some of the most significant exhaustion points that this altcoin has gone through over the past three months when looking at its daily chart.
For instance, in early June, when the LINK surged to a high of over $4.6, the TD setup presented a sell signal in the form of a green nine candlestick. Following the bearish formation, the decentralized oracles token went through a bearish impulse that saw its price plunge over 17%.
The TD index was also able to precisely estimate that Chainlink was sitting in overbought territory on Jul. 9 and Jul. 18. After these sell signals were presented, LINK pulled back by more than 12% and 22%, respectively.
Recently, this technical indicator has again suggested that LINK is poised for further correction.
It presented a green nine candlestick on the daily chart that transitioned into a red one candle due to a spike in sell orders. If validated, Chainlink could be bound for a one to four candlesticks correction.
The parabolic stop and reverse, or “SAR,” add credence to the pessimistic outlook. This trend-following indicator forecasts that LINK’s uptrend reached exhaustion, within the same time frame.
Each time the stop and reversal points move above the price of an asset, it is considered to be a negative sign.
The recent flip over indicates that the direction of Chainlink’s changed from bullish to bearish. Based on historical data, the stop and reversal system appears to be highly effective in determining the course of this altcoin’s trend.
In fact, the last two times the parabolic SAR flipped from bullish to bearish within the 1-day chart, LINK’s price dropped by 17% and 20%, respectively. These percentages only include the losses incurred the moment the bearish formations developed.
In the event of a steeper decline, IntoTheBlock’s “In/Out of the Money Around Price” (IOMAP) model reveals that one of the most significant supply walls underneath Chainlink sits at $14.7. Based on this on-chain metric, roughly 3,600 addresses had previously purchased nearly 838,000 LINK around this price level.
Such a considerable area of interest may have the ability to absorb some of the selling pressure. Holders within this price range would likely try to remain profitable in their long positions.
They may even buy more tokens to avoid seeing their profitable investments turn red.
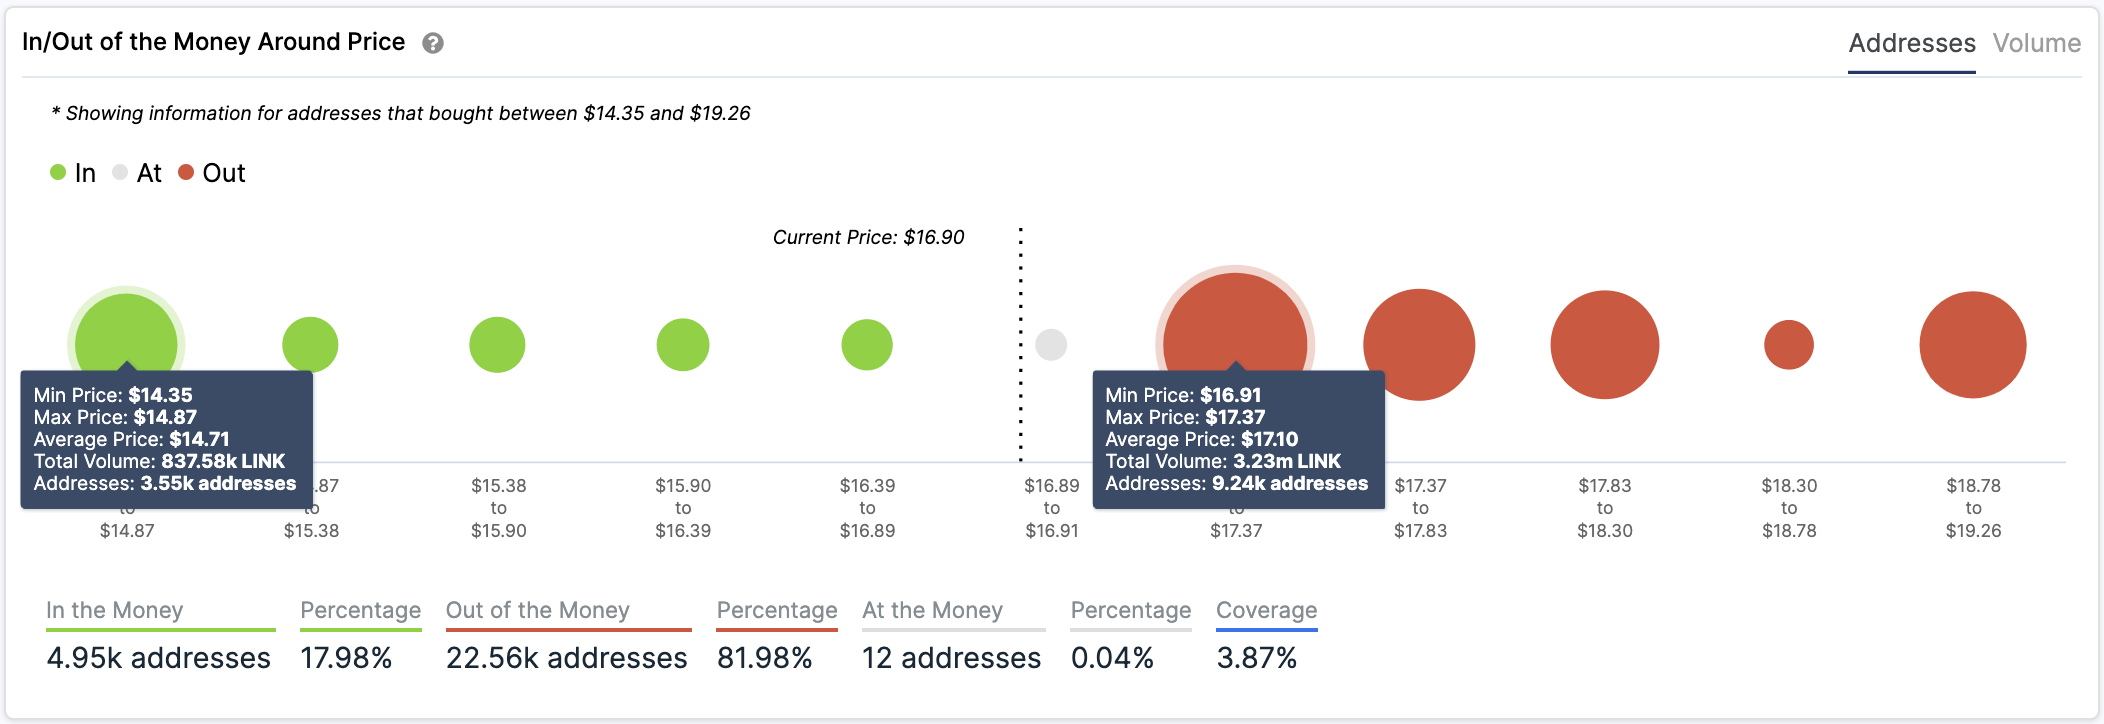
On the flip side, the IOMAP cohorts show that Chainlink faces stiff resistance ahead. Approximately 9,200 addresses are holding over 3.2 million LINK between $16.9 and $17.4.
Given the significant number of addresses that are currently “Out of the Money,” it is very likely that they will try to break even each time this cryptocurrency rises. Subsequently increasing the selling pressure behind it.
It is worth noting that after the massive gains that Chainlink has posted over the past few months, a steep correction would likely help keep the uptrend healthy. Sidelined investors may take advantage of the low prices to get back into the market.
A new influx of capital could propel prices further up and allow the upward trend to resume.