
ATOM took heavy damage
Cosmos Price Analysis ATOM / USD: Slow Recovery
ATOM is showing signs of recovery after months-long price drop.
- The one-hour and daily time frames suggest a bullish reversal may be about to occur
- Multiple time frames show sizeable amounts of positive MACD price divergence
Cosmos has started the new trading week in a positive fashion, after suffering its largest-ever monthly decline since its inception. The ATOM / USD pair is currently gaining over five percent intraday, after falling below the 2.00 level for the first time over the weekend.
The cryptocurrency suffered its second month of double-digit declines in August, wiping of over forty percent of its value. At current trading levels Cosmos is down some seventy percent from its all-time price high, and is at its most oversold on record, according to the daily RSI indicator.
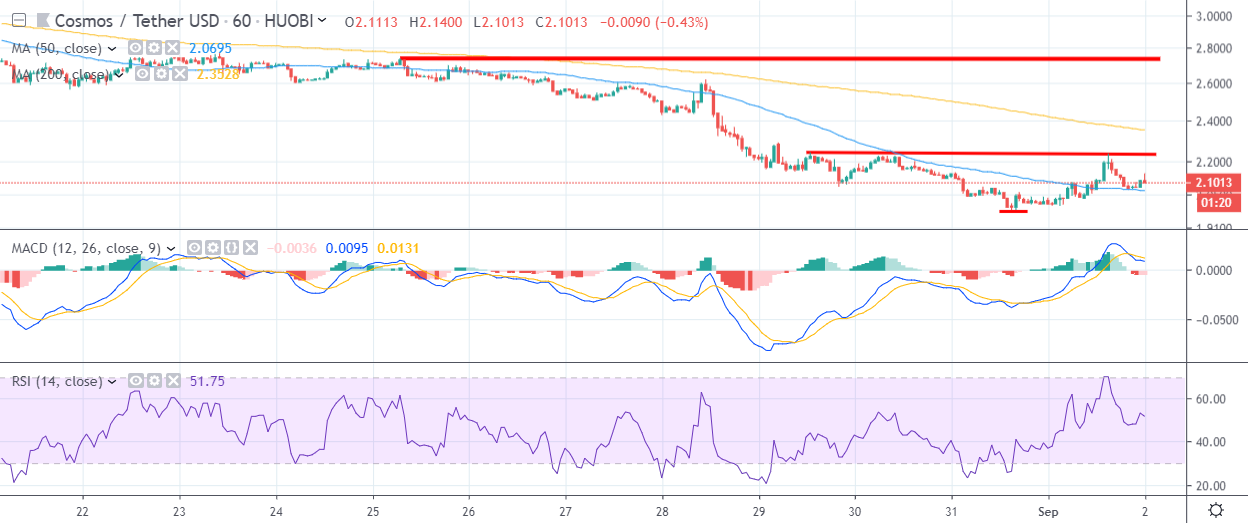
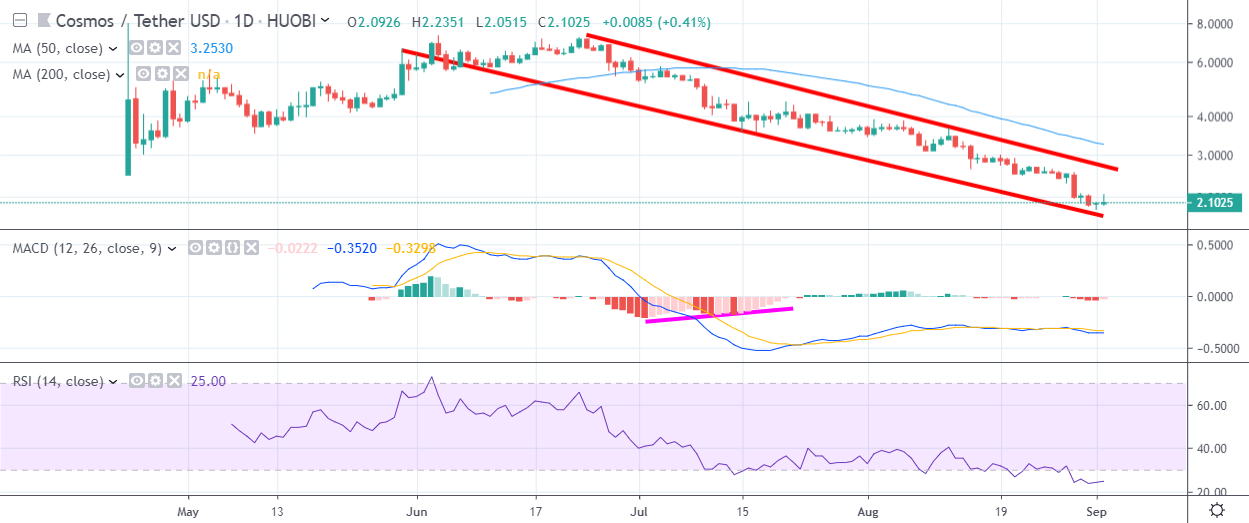
From a technical perspective, the short-term and medium-term outlook certainly for Cosmos appears bleak, although the one-hour and daily time frame suggest a strong recovery could soon take place. The one-hour time frame is showing the emergence of a bullish reversal pattern, while both the lower and higher time frames show significant amounts of positive MACD price divergence.
The bullish reversal pattern on the one-hour time frame suggests a recovery back toward the 2.70 level, at a minimum, with the possibility of a recovery towards the 3.00 level. The daily time frame is even more positive and suggests a medium to longer-term recovery back towards the 5.88 level.
According to the latest sentiment data from TheTIE.io, the short-term sentiment towards Cosmos is quite bearish, at 38.00 %, while the overall long-term sentiment towards the cryptocurrency is totally neutral, at 50.00%.
Upside Potential
The one-hour time frame is showing that a bullish inverted head and shoulders pattern is starting to take shape, with the 2.22 level the neckline of the pattern and breakout area. The overall size of the pattern suggests a recovery towards the 2.70 level may soon be coming.
The previously mentioned bullish MACD divergence on the four-hour and daily frame is certainly worth watching, as it extends back toward the $5.88 level. The daily time frame also shows that the ATOM / USD pair is trapped within a falling price channel, with the 2.70 level as the key upside breakout area to watch.
Downside Potential
The downside potential for the ATOM / USD pair is likely to open-up if we see the cryptocurrency falling below its current all-time price low. A lower monthly-low is likely to suggest that the cryptocurrency has yet to find a meaningful price floor.
The daily time frame is showing the 1.90 level offers the strongest form of technical support below the 1.97 level, as it represents downward trendline support from the falling price channel.
Summary
After suffering a severe multi-month price drop, the technicals suggest that Cosmos may start to stabilize and potentially retrace a decent portion of its recent losses.
In the short-term the 2.70 level is highlighted as a likely target, while medium to long-term analysis points to a possible recovery above the 5.00 level.
To get a quick refresher course on Cosmos check out our coin guide here.