
Crucial Technical Index Predicts an Imminent Bitcoin Breakout
The flagship cryptocurrency has failed to spark interest among investors due to its lackluster price action.
Although Bitcoin has been consolidating within a narrow trading range, one technical index estimates BTC’s price could soon face extreme volatility.
Momentum Builds for a Bitcoin Breakout
Bitcoin continues to disappoint investors as its price trades sideways with few clues about where it’s headed next. An ongoing consolidation phase has defined the last four days as the pioneer cryptocurrency held within a tight $130 trading range.
Since Jul. 10, each time BTC has risen to the $9,330 resistance level, its price gets rejected by this hurdle and pulls back to the $9,200 support wall. From this point, the flagship cryptocurrency bounces back to resistance, and so on.
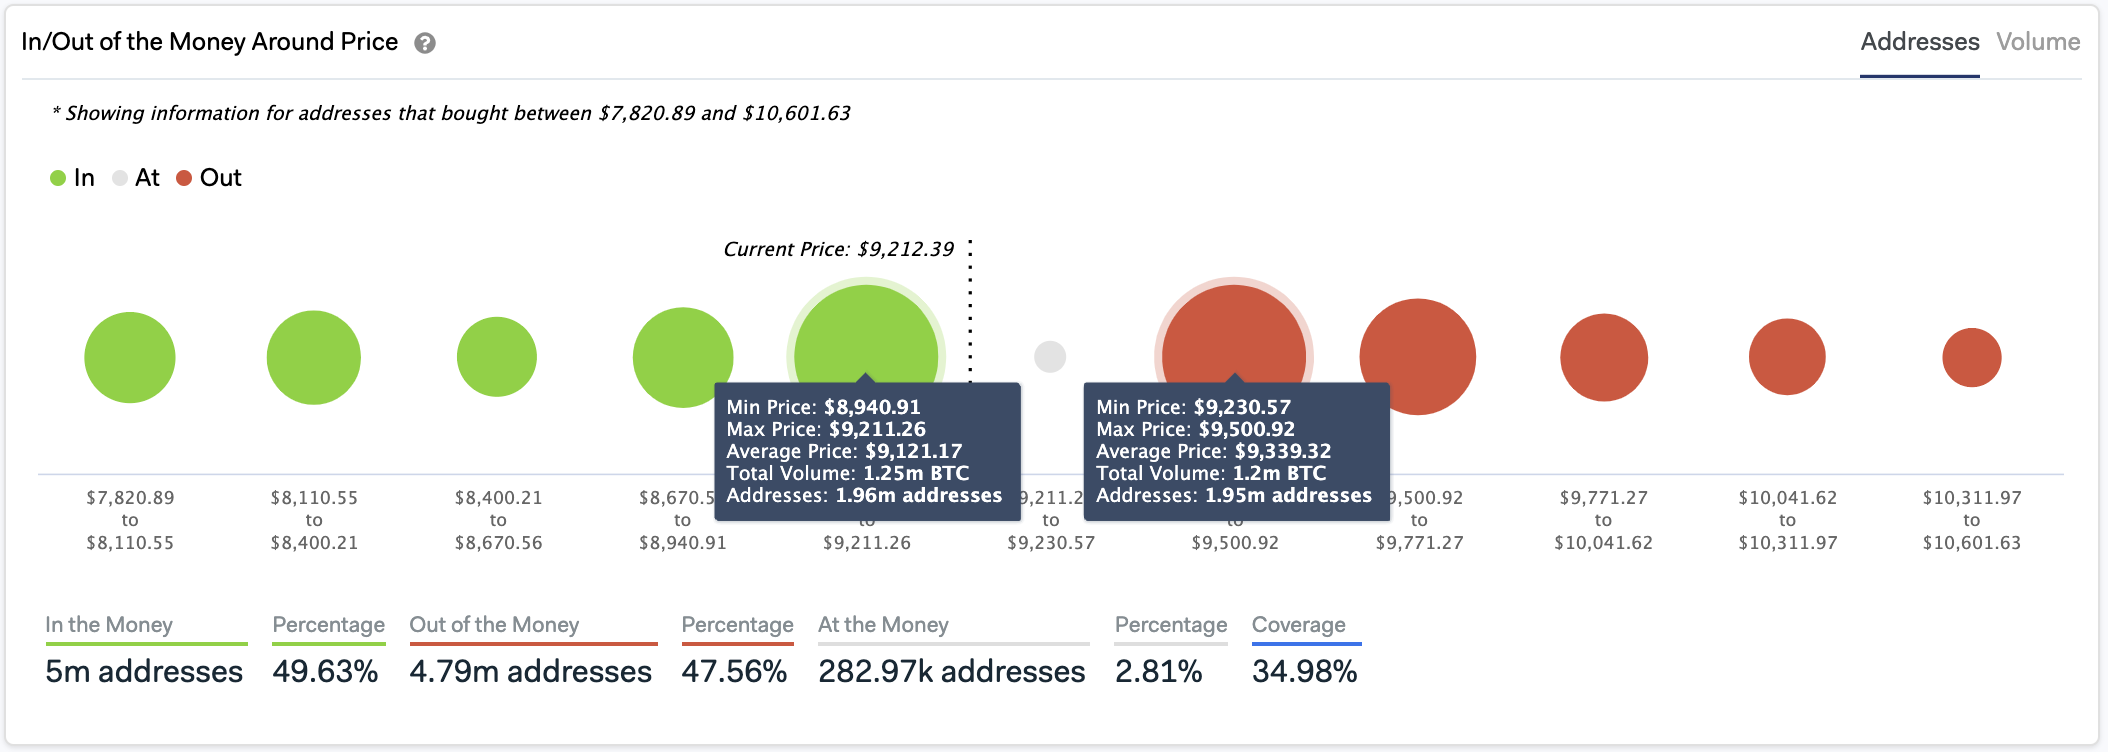
IntoTheBlock’s “In/Out of the Current Money Around Price” model reveals these price zones are quite strong. Roughly 2 million addresses had previously purchased over 1.2 million BTC around $9,330 and $9,200.
Holders within the higher range seem to be trying to break even each time Bitcoin rises, while those in the lower range are trying to remain profitable during each downswing. These two trading groups are compressing the price action into a narrower trading range until one side breaks.
A similar story can be seen on BTC’s 1-day chart, where the Bollinger bands have been forced to squeeze due to the lackluster price action.
Squeezes are indicative of periods of low volatility, but wild price movements typically succeed them. The longer the squeeze, the higher the probability of a strong breakout out.
Even though momentum builds up for a significant price movement, this technical index does not provide a clear path for the direction of the trend. Thus, the area between the $9,330 resistance and $9,200 support level can be considered a reasonable no-trade zone.
Only a daily candlestick close above or below these price hurdles will determine whether Bitcoin will break up or down.
Potential Targets Ahead of Bitcoin
By measuring the Fibonacci retracement indicator between the $14,000 high of late June 2019 with mid-March’s low of $4,000, several potential targets are given.
On the upside, if Bitcoin manages to move past the $9,330 supply barrier, it may rise towards the 38.2% or 23.6% Fibonacci retracement level. These resistance walls sit at $10,070 and $11,500, respectively.
Conversely, a spike in the selling pressure behind the bellwether cryptocurrency might have the strength to push it below the $9,200 support.
Under such circumstances, BTC may fall to the 50% or 61.8% Fibonacci retracement level. These critical areas of support sit at $8,900 and $7,750, respectively.
The Odds Seem to Favor the Bulls
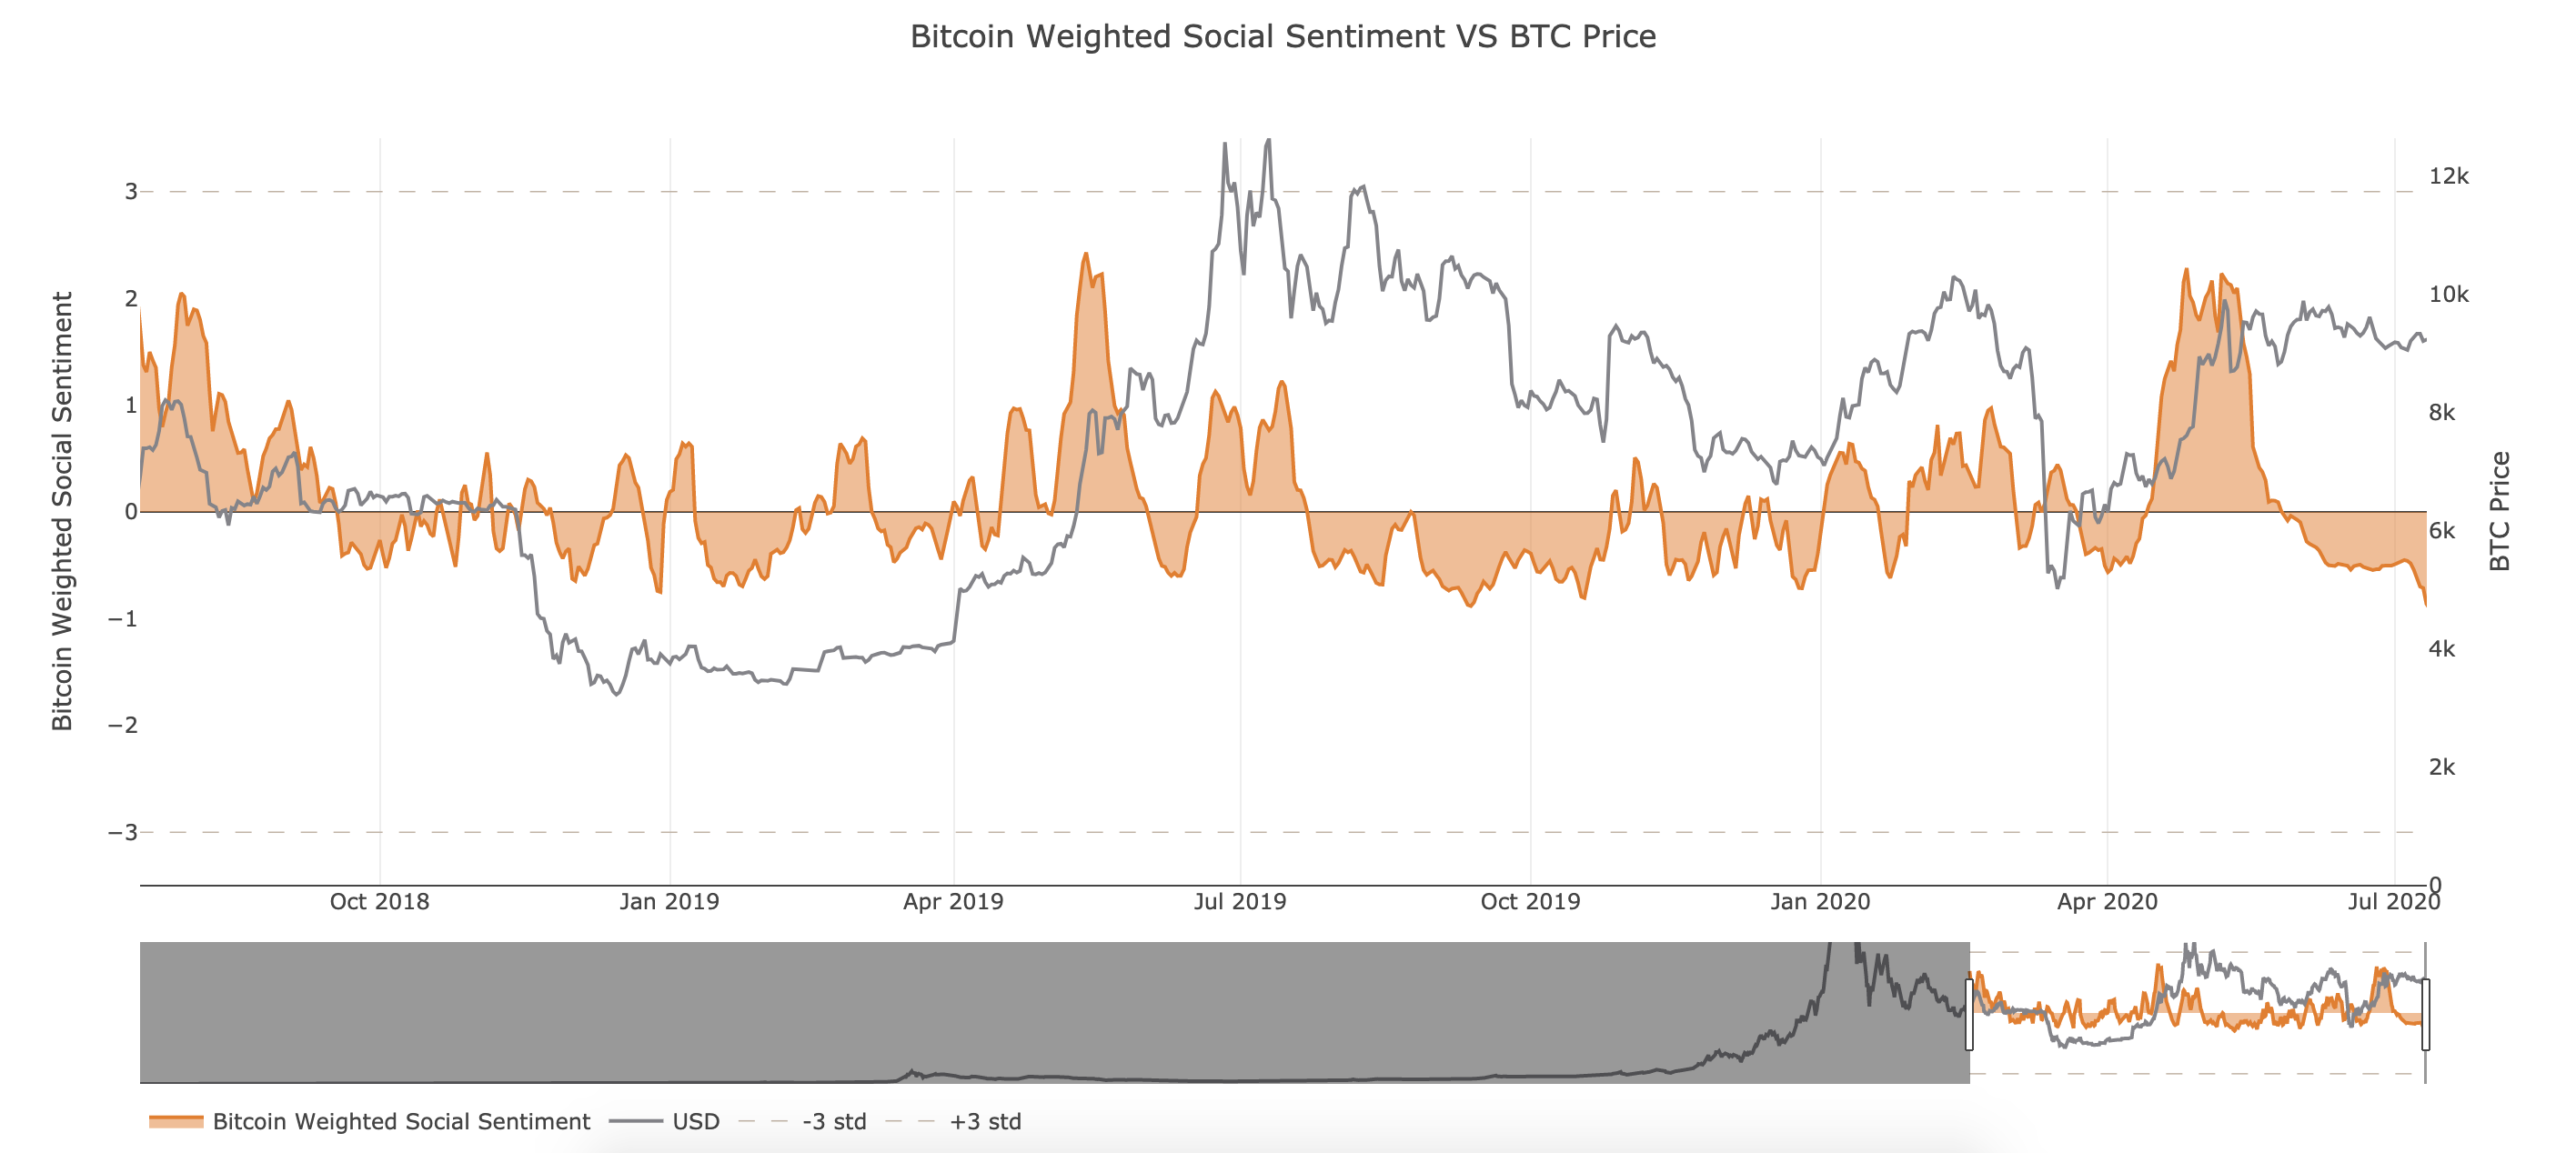
While the pioneer cryptocurrency remains flat trading between $9,330 and $9,200, market participants seem to have shifted their focus towards lower-cap altcoins. Data from Santiment reveals that the number of BTC-related mentions across different social media networks has dropped significantly over the past week.
Bitcoin’s weighted social sentiment hit its lowest levels in over two years. This negative social sentiment is a direct result of the fading hype over the recent halving and the attention that altcoins have managed to gain.
But the outcome could benefit those betting on an upside, according to Brian Quinlivan, marketing and social media director at Santiment.
“The net result of this is actually good for the bulls, as assets perform best when social perception is poor,” said Quinlivan.
Regardless, traders must wait patiently on the sidelines to avoid getting caught on the wrong side of the trend. This recommendation is especially important now that Bitcoin seems to be on the cusp of its next bullish cycle.