
Crypto.com Chain Price Analysis CRO / BTC: Limited Growth
Crypto.com launched the cards and bumped the price.
- Crypto.com Chain has an increasingly bullish short-term bias against Bitcoin
- The four-hour time frame shows that a large head and shoulders pattern is taking shape
- The daily time frame shows that the CRO / BTC pair is trading within a huge descending wedge pattern
Fundamental Analysis
CRO price is rallying after the project announced that its MCO Visa Cards are now shipped to customers in the United States. People started to receive the cards already. This is a big milestone for the project, which will allow it to further expand the user base and improve the adoption of its platform.
Crypto.com Chain / Bitcoin Short-term price analysis
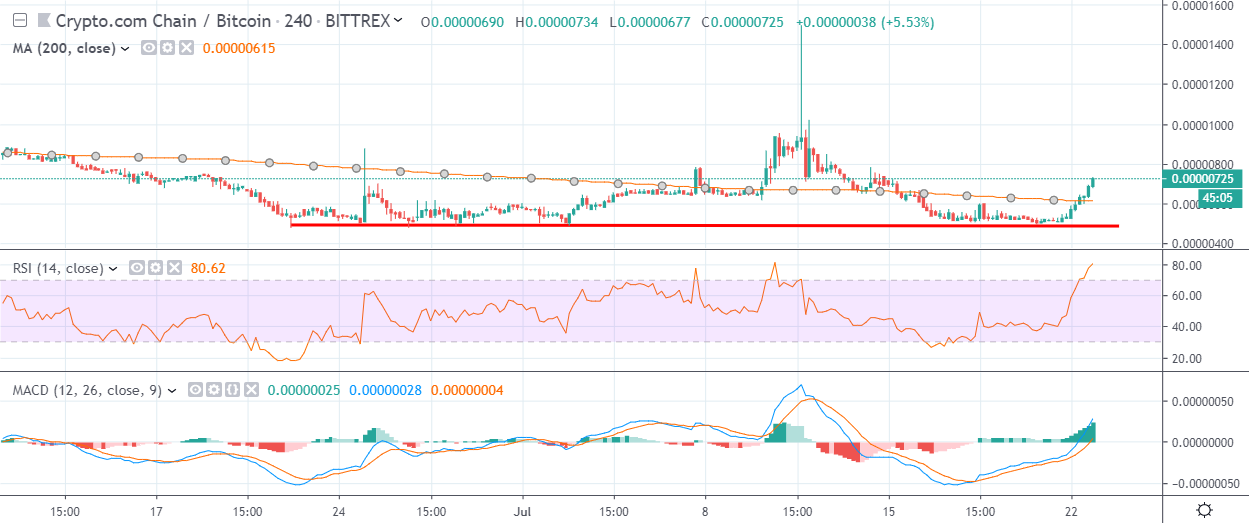
Crypto.com Chain has a bullish short-term trading bias against Bitcoin, with the CRO / BTC pair trading back above its 200-period moving average on the four-hour time frame.
The four-hour time frame is showing that the CRO / BTC pair may be in the process of forming a right-hand shoulder to complete a bearish head and shoulders pattern.
Technical indicators on the four-hour time frame are bullish and continue to issue buy signals.
Pattern Watch
Traders should note that the June 2019 trading high is the strongest form upcoming technical resistance for the CRO / BTC pair.
Relative Strength Index
The Relative Strength Index on the four-hour time frame is bullish, although it is fast approaching oversold conditions.
MACD Indicator
The MACD indicator on the four-hour time frame is bullish and continues to issue a strong buy signal.
Crypto.com Chain / Bitcoin Medium-term price analysis
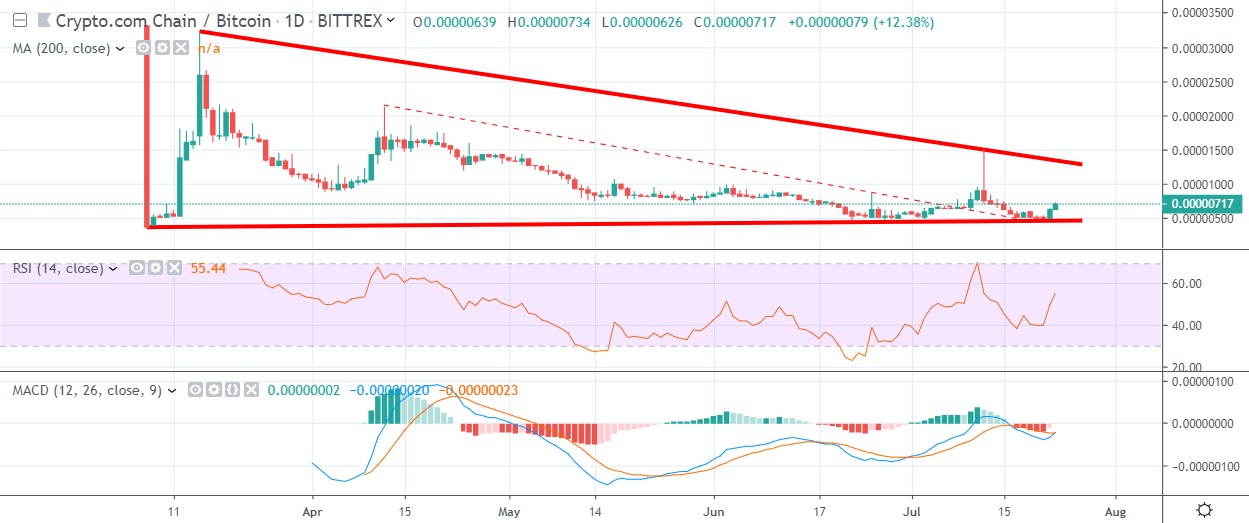
Crypto.com Chain has a bearish medium-term trading bias against Bitcoin, with the CRO / BTC pair still contained below key resistance on the daily time frame.
The daily time frame shows that the CRO / BTC pair is still creating bearish lower lows and lower highs, placing the emphasis on further medium-term weakness.
Technical indicators across the daily time are turning higher and are now issuing buy signals.
Pattern Watch
Traders should note that the CRO / BTC is also trapped within a huge descending wedge pattern on the daily time frame.
Relative Strength Index
The RSI indicator has turned bullish on the daily time frame and continue to generate a strong buy signal.
MACD Indicator
The MACD indicator has turned bullish on the daily time frame and is currently generating a buy signal.
Conclusion
Crypto.com Chain is starting to take advantage of the recent weakness in Bitcoin, placing the emphasis on more CRO / BTC short-term gains.
Despite the bullish signals coming from both the RSI and MACD indicators, the daily time frame still suggests that medium-term upside for the cryptocurrency may be limited.