 Earn with Nexo

Crypto.com Chain Price Analysis CRO / USD: Holding The Cards
The technical outlook remains weak despite positive news.
- Crypto.com Chain has a neutral short-term trading outlook
- The four-hour time frame continues to show a valid bearish pattern
- The daily time frame shows that the CRO / USD pair remains trapped within a descending price channel
Fundamental Analysis
Crypto.com Chain has surged after the company announced that it’s planning to launch its U.S. Visa card in partnership with Metropolitan Commercial Bank on July 14, 2019. This will further increase the project’s user base, which should positively affect the demand for the CRO token.
Crypto.com Chain / USD Short-term price analysis
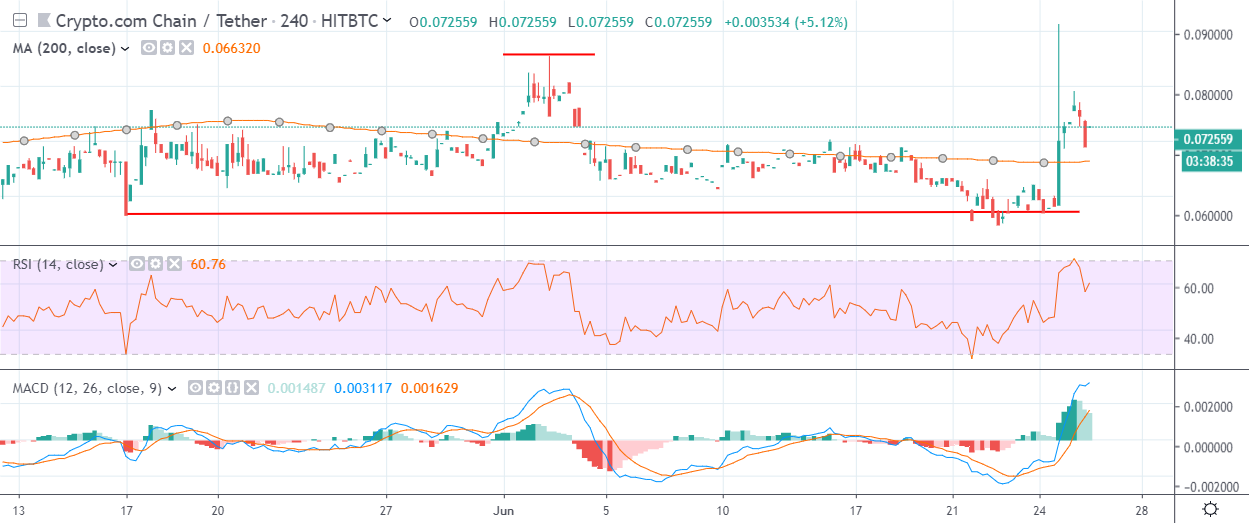
Crypto.com Chain has a neutral short-term trading bias, with the CRO / USD pair falling back towards key technical support.
The four-hour time frame is showing that the CRO / USD pair has reversed sharply lower after bulls failed to invalidate a large head and shoulders pattern.
Technical indicators on the four-hour time frame are starting to appear overstretched.
Pattern Watch
Traders should note that the short-term trend will turn bearish if price starts to trade below the CRO / USD pair’s 200-period moving average on the four-hour time frame.
Relative Strength Index
The Relative Strength indicator on the four-hour time frame is turning lower and attempting to correct from overbought conditions.
MACD Indicator
The MACD indicator on the four-hour time frame is still bullish, although it is starting to appear overstretched.
Crypto.com Chain / USD Medium-term price analysis
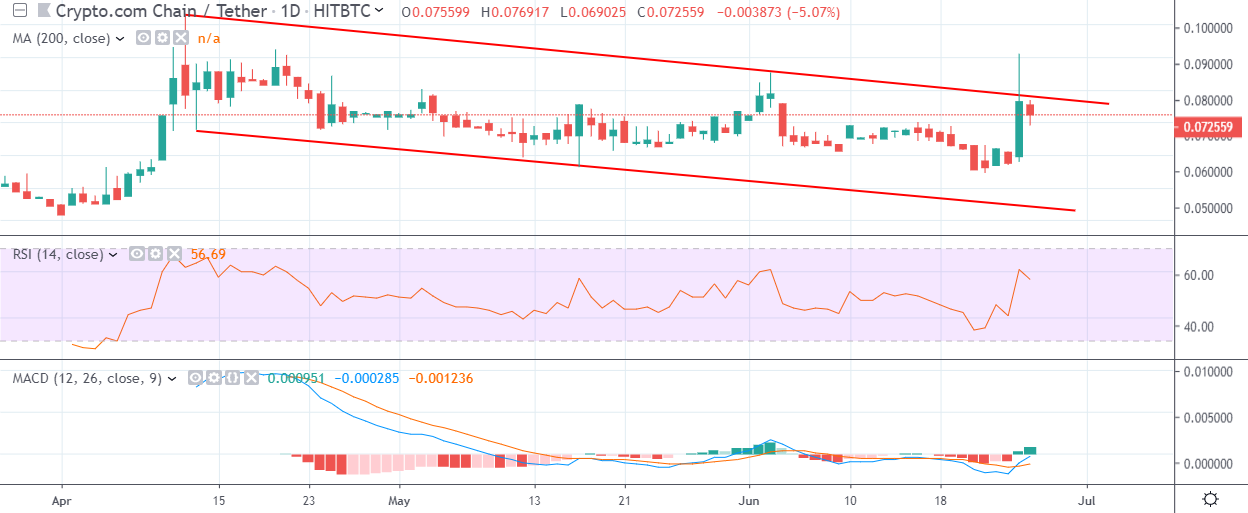
Crypto.com Chain has a neutral medium-term outlook, with the CRO / USD pair so far unable to perform a bullish technical breakout.
The daily time frame shows that the CRO / USD pair remains trapped within a descending price channel, with bulls unable to hold price above trendline resistance.
Technical indicators across the daily time frame continue to generate a buy signal.
Pattern Watch
Traders should closely monitor daily price closes around trendline resistance for confirmation of valid bullish breakout.
Relative Strength Index
The RSI indicator is neutral on the daily time frame is bullish and continues to generate a buy signal.
MACD Indicator
The MACD indicator is bullish on the daily time frame and is generating a buy signal.
Conclusion
Both time frames highlight the recent failed technical breakouts, with Crypto.com Chain bulls still unable to hold price above major resistance.
Continued failure around key technical resistance may see sellers start to return, shifting the path of least resistance shift to the downside.