Dash DASH / USD Price Analysis: Uncertain Direction
DASH is technically oversold, with a strong chance of stabilization if bulls can recover above $90.
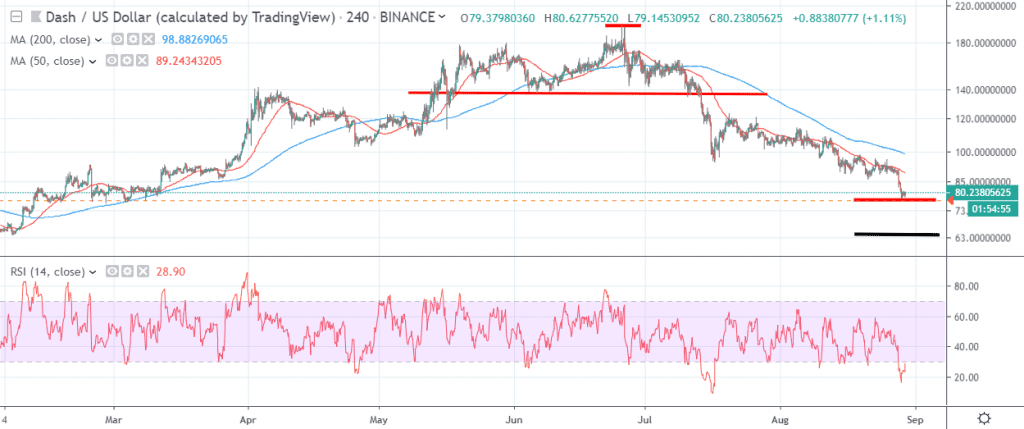
- The four-hour and daily time frames show that Dash is now technically oversold
- Technical analysis highlights substantial amounts of positive MACD price divergence
Dash has fallen to its lowest trading level since March 8th this year, as the popular cryptocurrency has been on a virtual one-way decline since peaking around late June. The Dash / USD pair has largely been tracking the broader crypto market lower, although technical selling in the cryptocurrency accelerated once the $100.00 support level was breached.
At current trading levels, Dash is trading down by over sixty percent from its 2019 price peak, while the cryptocurrency is trading virtually flat on the year. Dash is one of the more notable cryptocurrencies that has failed to retrace back towards its lofty price highs of early 2018.
From a technical perspective, Dash is showing some near-term positive developments and also some medium-term bearish issues which are worth looking at in further detail. In the near-term, Dash has moved into oversold territory according to the RSI indicator, the recent decline has also created notable positive MACD divergence, which extends back towards the $120.00 level.
Furthermore, a significant head and shoulders pattern on the four-hour time frame has now reached its overall downside projection, around the $80.00 mark. If the current monthly low holds, within the margin of error of around $10.00, the Dash / USD pair could retrace back towards the $120.00 level.
From a sellers perspective, an extremely bearish death-cross is underway on the daily time frame. Additionally, a major trendline breakout has just taken place which could signal a move towards at least the $60.00 support level.
According to the latest sentiment data from TheTIE.io, the short-term sentiment towards Dash is fairly high considering the recent drop, at 60.00 %, while the overall long-term sentiment towards the cryptocurrency is bearish, at 37.00%.
Upside Potential
The four-hour time frame is showing that stabilization will occur if bulls can move price above the $90.00 level. Key resistance then comes in around the $98.00 level, although the $100.00 level may be key for sentiment
The previously mentioned bullish MACD divergence is also worth watching, as it extends back toward the $120.00 level. The daily time frame shows that a move above the $160.00 level is a game changer for the cryptocurrency, which could eventually spark a huge rally.
Downside Potential
The downside potential for the Dash / USD pair is likely to open-up if we see a sustained drop below the $80.00 level. As previously mentioned, the $60.00 level would then come into focus, given that a major trendline break is in play.
The daily time frame then shows that December 2018 trading low, at $55.00, is really the only notable form of technical support.
Summary
Technical analysis suggests that the Dash / USD is trading at a technical crossroads around the $80.00 level. A bullish reversal points to a short-term move back towards the $120.00 level, while a continuation of recent bearish decline highlights the $60.00 to $55.00 levels as a likely near-term target.
To get a quick refresher course on Dash check out our coin guide here.
A deep dive look into DASH and Dashpay is available in our DARE.