
Dash Price Analysis DASH / USD: Breakdown Incoming
Selling pressure keeps mounting.
- DASH has a bearish short-term outlook, with the cryptocurrency remaining under technical selling pressure
- The four-hour time frame shows that the DASH / USD pair continues to create bearish lower lows and lower highs
- The daily time frame continues to highlight a bearish double-top pattern formation
Dash / USD Short-term price analysis
DASH has a bearish short-term outlook, with the cryptocurrency remaining under selling pressure below its 200-period moving average on the four-hour time frame.
The four-hour time frame is showing that the DASH / USD pair is once again making bearish lower lows and lower highs, placing the emphasis on further downside.
Technical indicators are bearish on the four-hour time frame and continue to generate sell signals.

Pattern Watch
Traders should note that a bearish double-top pattern is currently in play across the four-hour time frame.
Relative Strength Index
The RSI indicator remains bearish on the four-hour time frame and shows scope for further downside.
MACD Indicator
The MACD indicator is bearish on the four-hour time frame and continues to generate a sell signal.
Dash / USD Medium-term price analysis
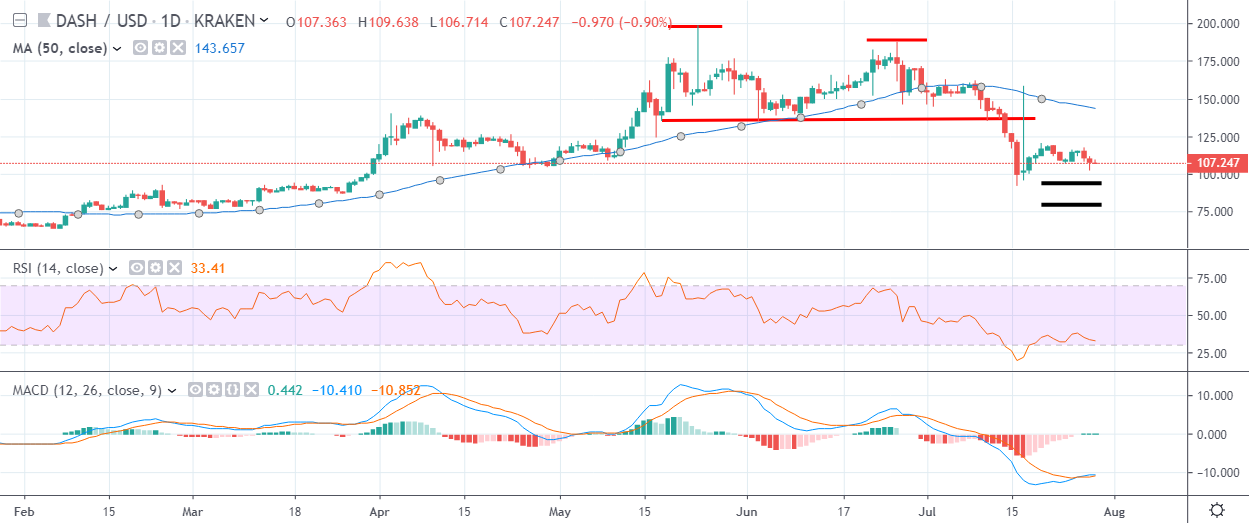
DASH has a bearish medium-term outlook, with the cryptocurrency remaining trapped below its trend defining its 200-day moving average.
The daily time frame shows that a bearish double-top pattern continues to weigh on the DASH / USD pair, leaving the cryptocurrency exposed to more technical selling.
Technical indicators across the daily time frame are bearish, although they are extremely oversold at current levels.
Pattern Watch
Traders should note that the $75.00 level is the overall bearish target of the double-top pattern formation.
Relative Strength Index
The RSI indicator remains bearish on the daily time frame, although it is attempting to correct from extreme oversold conditions.
MACD Indicator
The MACD indicator on the daily time remains bearish, although the signal line is currently extremely oversold.
Conclusion
DASH remains under downside pressure across both time horizons, with any minor upside technical corrections being swiftly sold lower.
A bearish breakdown below the current monthly trading low is likely to prompt an eventual test of the $75.00 level, which may provide an excellent buying opportunity for long-term DASH / USD bulls.
To get a quick refresher course on Dash check out our coin guide here.
A deep dive look into DASH and Dashpay is available in our DARE.