 Earn with Nexo

Dash Price Analysis DASH / USD: Dashing To New Lows
Dash has lost almost 50% of its value since June.
- Dash has a bearish short-term outlook, with the cryptocurrency falling to its lowest level since March 2019
- The DASH / USD pair has now fallen below its 200-day moving average
- The daily time frame continues to show a valid inverted head and shoulders pattern
Dash / USD Short-term price analysis
Dash has a bearish short-term outlook, with the cryptocurrency tumbling to its lowest trading level since March 2019.
The four-hour time frame shows that a head and shoulders pattern has now been triggered, with the bearish pattern holding a downside projection of around $60.00.
Technical indicators are extremely bearish on the four-hour time frame and continue to generate a sell signal.
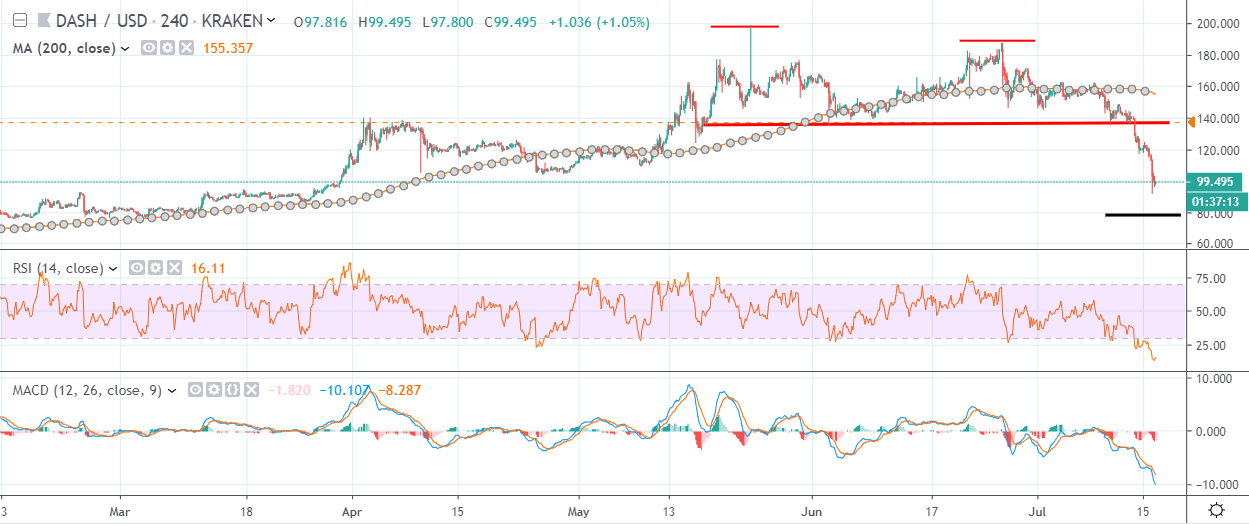
Pattern Watch
Traders should note that a bearish double-top pattern is also weighing on the DASH / USD pair.
Relative Strength Index
The RSI indicator has turned bearish on the four-hour time frame, although it is now trading at its most oversold level since December 2018.
MACD Indicator
The MACD indicator is bearish on the four-hour time frame and continues to generate a strong sell signal.
Dash / USD Medium-term price analysis
Dash has a bearish medium-term outlook, with the cryptocurrency trading below its 200-day moving average for the first time since March 29th this year.
The daily time frame shows that an inverted head and shoulders pattern remains valid, although sellers are working hard to invalidate the bullish pattern.
Technical indicators across the daily time frame are extremely bearish and continue to issue strong sell signals.
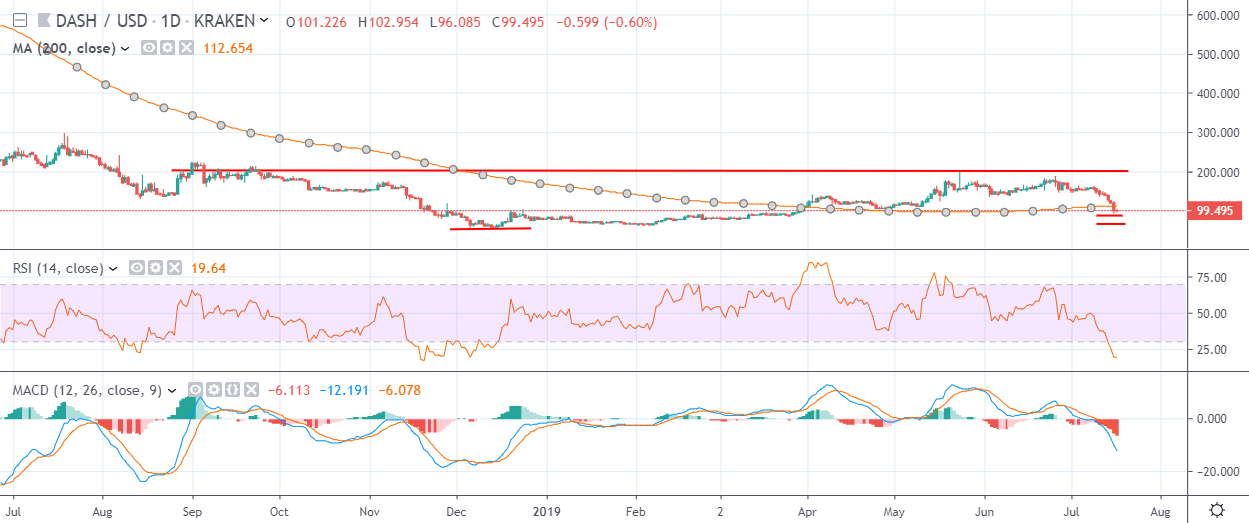
Pattern Watch
Traders should note that the $80.00 level is major technical support below the DASH / USD pair’s 200-day moving average.
Relative Strength Index
The RSI indicator remains bearish on the daily time frame and is now at its most oversold since December 2018.
MACD Indicator
The MACD indicator on the daily time remains heavily bearish, with both the MACD signal line and histogram generating strong sell signals.
Conclusion
Dash is under severe selling pressure across both time horizons, with the cryptocurrency eroding over forty-five percent of its value since June 27th this year.
The bearish head and shoulders pattern on the four-hour time frame suggests that the DASH / USD pair could fall towards at least the $80.00 level over the coming trading sessions.
To get a quick refresher course on Dash check out our coin guide here.