
Dash Price Analysis DASH / USD: Pausing For Breath
An increasingly bearish outlook is prevailing on all timeframes.
- DASH has a bearish short-term outlook, with the cryptocurrency trading below its 200-period moving average on the four-hour time frame
- The four-hour time frame shows that sellers are trying to invalidate an inverted head and shoulders pattern
- The daily time frame continues to show an extremely large bullish pattern
Dash / USD Short-term price analysis
DASH has a bearish short-term outlook, with the cryptocurrency trading under its key 200-period moving average on the four-hour time frame.
The four-hour time frame is showing that the DASH / USD is under selling pressure, with bears attempting to invalidate a large inverted head and shoulders pattern.
Technical indicators are bearish on the four-hour time frame and continue to generate a sell signal.
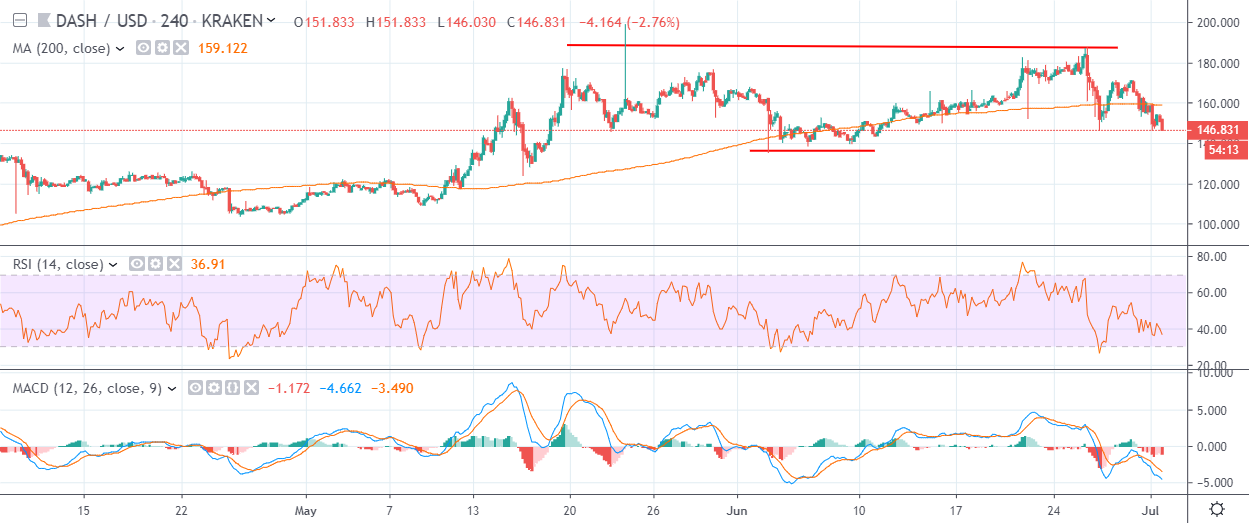
Pattern Watch
Traders should expect heavy technical selling will take place if the large inverted head and shoulders pattern on the four-hour time frame is invalidated.
Relative Strength Index
The RSI indicator has turned bearish on the four-hour time frame and shows scope to turn lower.
MACD Indicator
The MACD indicator is bearish on the four-hour time frame and continues to issue a sell signal.
Dash / USD Medium-term price analysis
DASH has a bullish medium-term outlook, with the cryptocurrency trading well above its trend defining 200-day moving average.
The daily time frame shows that a large inverted head and shoulders pattern remains valid, with the DASH / USD pair reversing sharply from the neckline of the bullish pattern.
Technical indicators across the daily time frame have turned heavily bearish and are issuing strong sell signals.
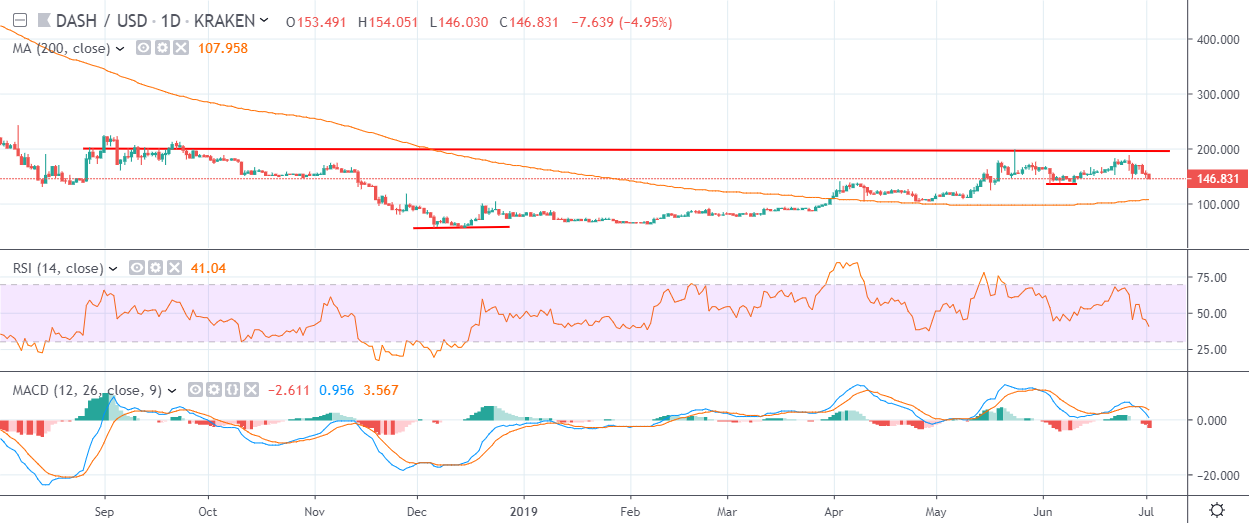
Pattern Watch
Traders should note that the DASH / USD pair could test towards its 200-day moving average if key upcoming support is broken.
Relative Strength Index
The RSI indicator has turned bearish on the daily time frame and highlights the growing medium-term selling pressure.
MACD Indicator
The MACD indicator on the daily time has turned bearish, with both the MACD signal line and histogram issuing strong sell signals.
Conclusion
DASH is starting to appear increasingly bearish in the short-term, with sellers increasingly close to invalidating the bullish pattern seen across the four-hour time frame.
With bearish sentiment spreading, the DASH / USD pair may now be headed for a crucial technical test of its trend defining 200-day moving average.
To get a quick refresher course on Dash check out our coin guide here.
A deep dive look into DASH and Dashpay is available in our DARE.