
DASH / USD Price Analysis: Bully For You
The broken descending triangle dominates the short term outlook, with buyers needing to correct it at all costs.
- DASH has a bullish short-term outlook, with the DASH / USD pair advancing to a fresh monthly trading high
- DASH has a bullish medium-term outlook, with the pair trading well above its 200-day moving average
- A bullish inverted head and shoulders pattern is starting to take shape on the daily time frame
Dash / USD Short-term price analysis
DASH has a bullish short-term outlook, with the cryptocurrency advancing to a fresh monthly trading high.
The four-hour time frame is showing that the DASH / USD pair has now invalidated a bearish head and shoulders pattern, with the April 2019 trading high the next major resistance area to watch above.
Technical indicators are rising on the four-hour time frame and continue to issue a strong buy signal.
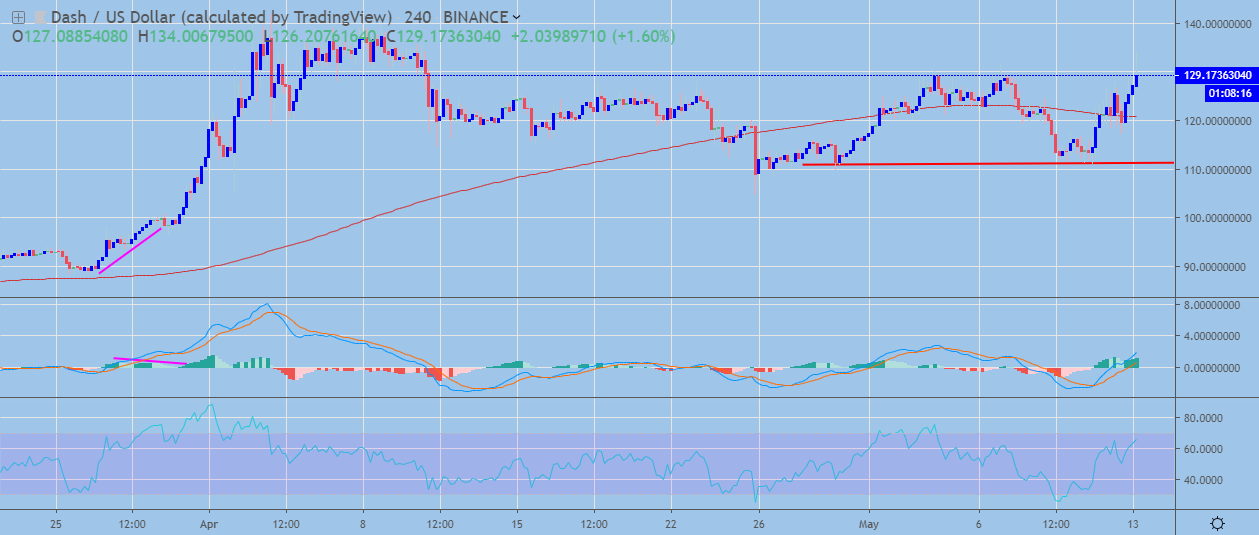
DASH / USD H4 Chart by TradingView
Pattern Watch
Traders should note that a large inverted head and shoulders pattern could start to form on the four-hour time frame.
Relative Strength Index
The RSI indicator is bullish on the four-hour time frame, although it is approaching overbought territory.
MACD Indicator
The MACD indicator has turned bullish on the four-hour time frame and continues to issue a strong buy signal.
Fundamental Analysis
Dash is trending up after the announcement that the “Dash Ventures” project is nearing completion. It will allow investment operations that will be funded by the network itself and will support the Dash ecosystem growth.
Dash / USD Medium-term price analysis
DASH has a bullish medium-term outlook, with the cryptocurrency trading well above its trend defining 200-day moving average.
The daily time frame is showing a large inverted head and shoulders pattern, while a smaller inverted head and shoulders pattern also appears to be in the process of forming.
Technical indicators across the daily time frame have turned bullish and are continuing to issue buy signals.
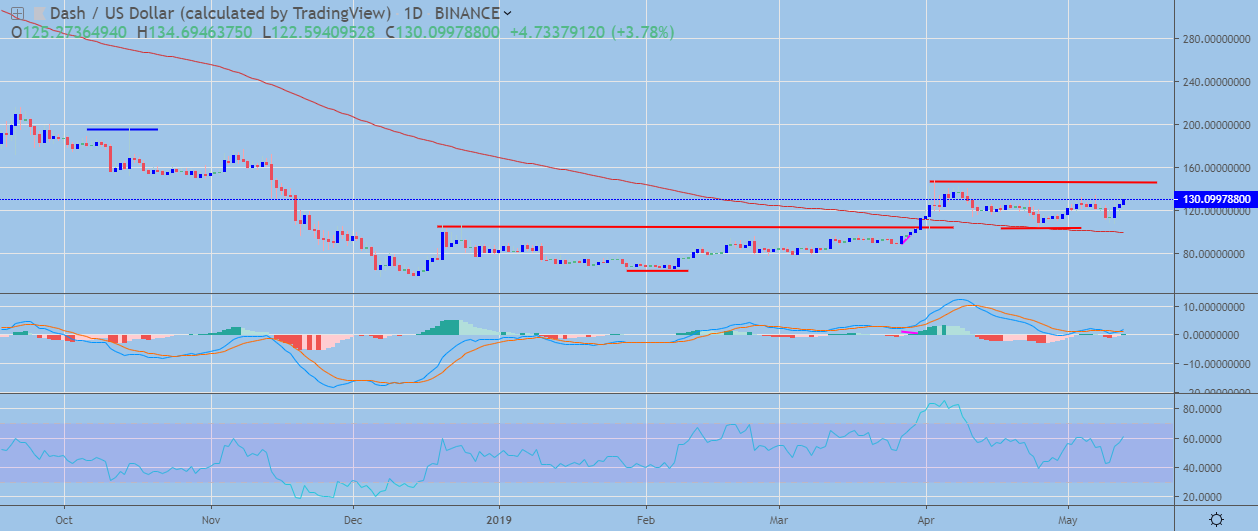
DASH / USD Daily Chart by TradingView
Pattern Watch
Traders should note that the October 2018 trading high is the upside target of the smaller inverted head and shoulders pattern.
Relative Strength Index
The RSI indicator has turned bullish on the daily time frame and is highlighting the growing buying pressure.
MACD Indicator
The MACD indicator on the daily time has turned bullish and shows scope for further upside.
Fundamental Analysis
In the medium term, Dash looks promising, with the number of upcoming releases and the introduction of investment foundation, the project has the potential to generate a lot of excitement around itself. This will likely attract additional investors to the ecosystem and support the value of its network.
Conclusion
DASH is looking increasingly bullish in the short-term, following the invalidation of the bearish pattern on the four-hour time frame.
The medium-term outlook for the DASH / USD pair is also bullish, with possible multiple inverted head and shoulders pattern forming and technical indicators on the daily time frame pointing to further gains ahead.
To get a quick refresher course on Dash check out our coin guide here.
A deep dive look into DASH and Dashpay is available here.