
After Decoupling, Cardano, 0x, and Kyber Network Now Face Exhaustion
Volatility is once again rampant in the cryptocurrency market, and ADA, ZRX, and KNC look poised for a correction.
Over the weekend, Cardano (ADA), 0x (ZRX), and Kyber Network (KNC) managed to decouple from the rest of the market posting significant gains. Now, multiple on-chain and technical indexes suggest that these altcoins are bound for a bearish impulse.
Cardano Facing Strong Resistance Ahead
Cardano has enjoyed a significant rally over the past week surging more than 40% in value. The smart contracts token went from trading at a low of $0.04 on Apr. 20 to recently hitting a high of $0.048.
Despite the impressive upswing, ADA appears to be approaching an important resistance barrier that could put a hold on any further uptrends.
IntoTheBlock’s “Global In/Out of the Money” (GIOM) model estimates that there is a massive supply wall sitting between $0.05 and $0.06. Around this price level, over 31,000 addresses bought roughly 4.75 billion ADA.
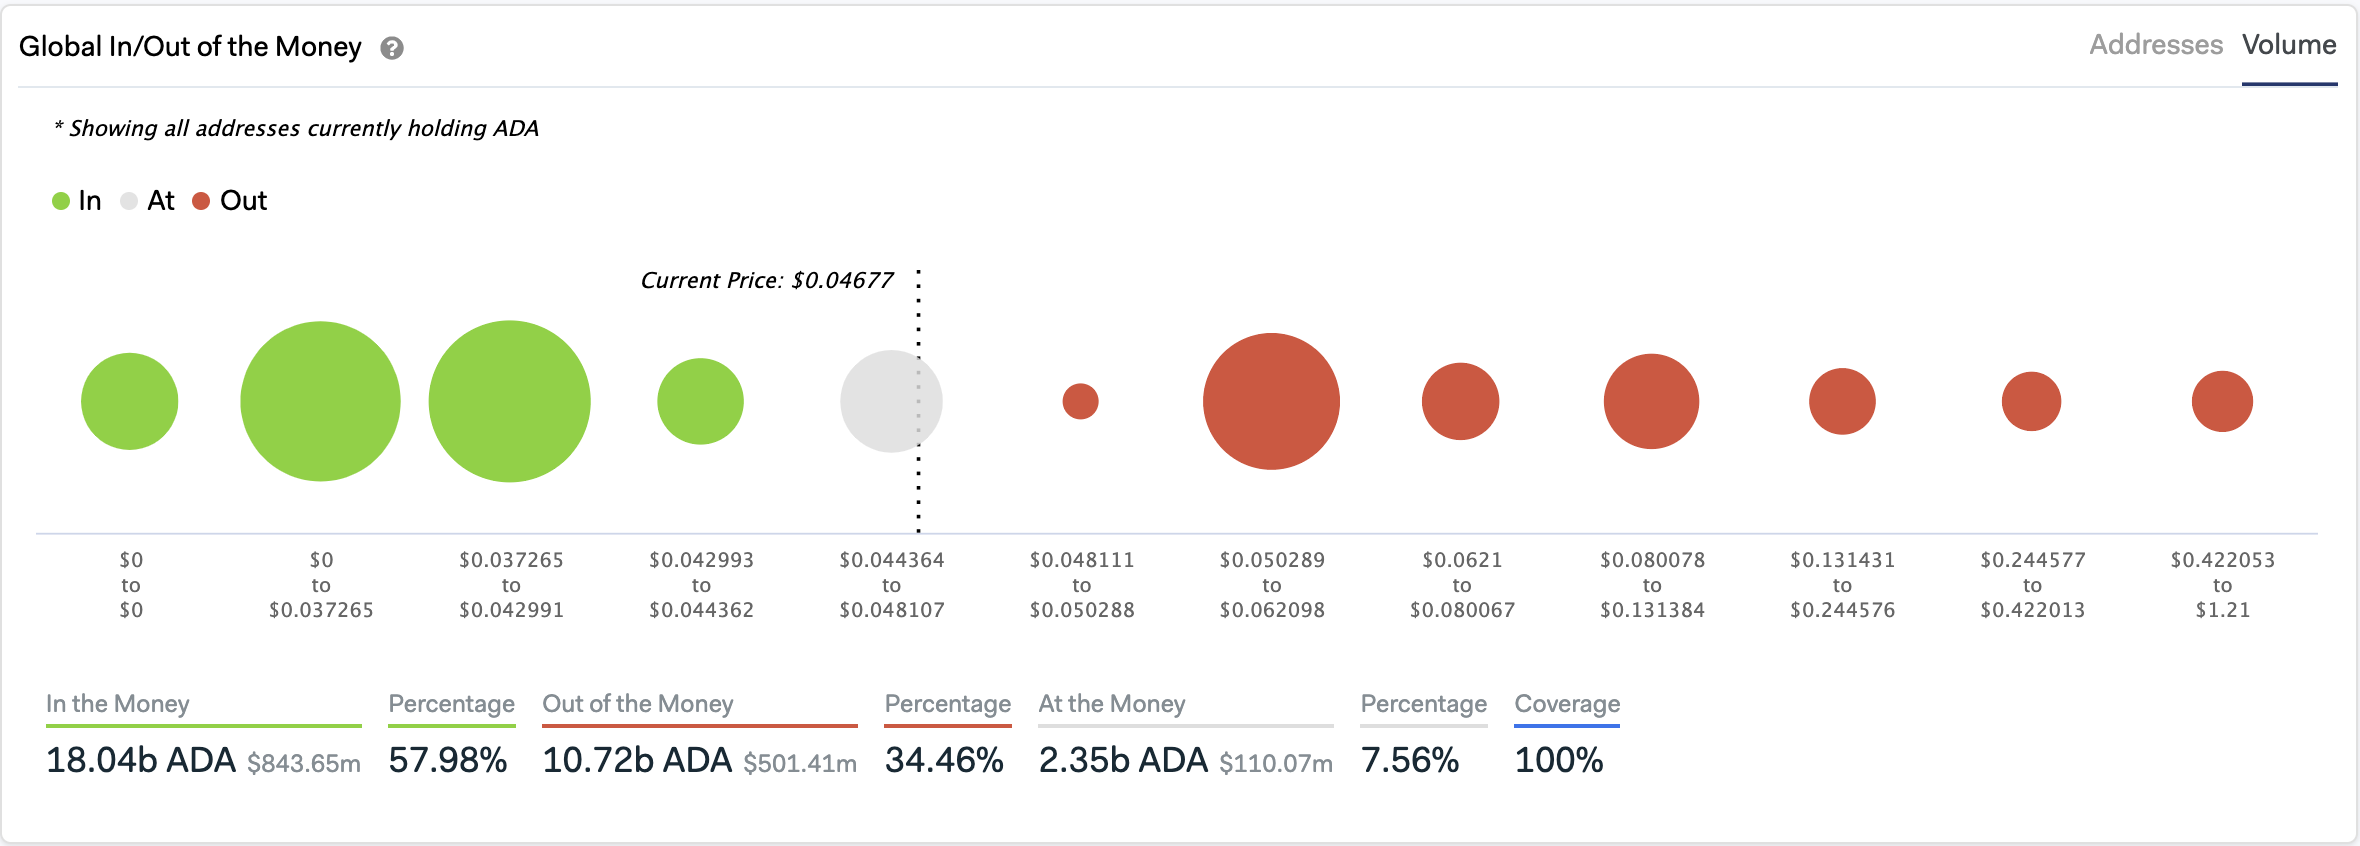
From a technical perspective, this hurdle is represented by the 100-three-day exponential moving average on ADA’s 3-day chart. Rejection from this resistance level could push Cardano back to its 50-three-day exponential moving average that is currently hovering around $0.041.
Here, the GIOM reveals that approximately 42,000 addresses are holding 7.34 billion ADA. In the event of a correction, this support level would likely hold and prevent the cryptocurrency from a further slump.
It is worth mentioning that if buying pressure behind Cardano is strong enough, it may allow the bulls to break above the 100-three-day exponential moving average.
The GIOM does not see any considerable supply wall above this resistance level. Therefore, it is reasonable to assume that ADA would likely jump rapidly toward its 200-three-day exponential moving average upon the break of the 100-three-day exponential moving average.
0x Appears to be Breaking Out
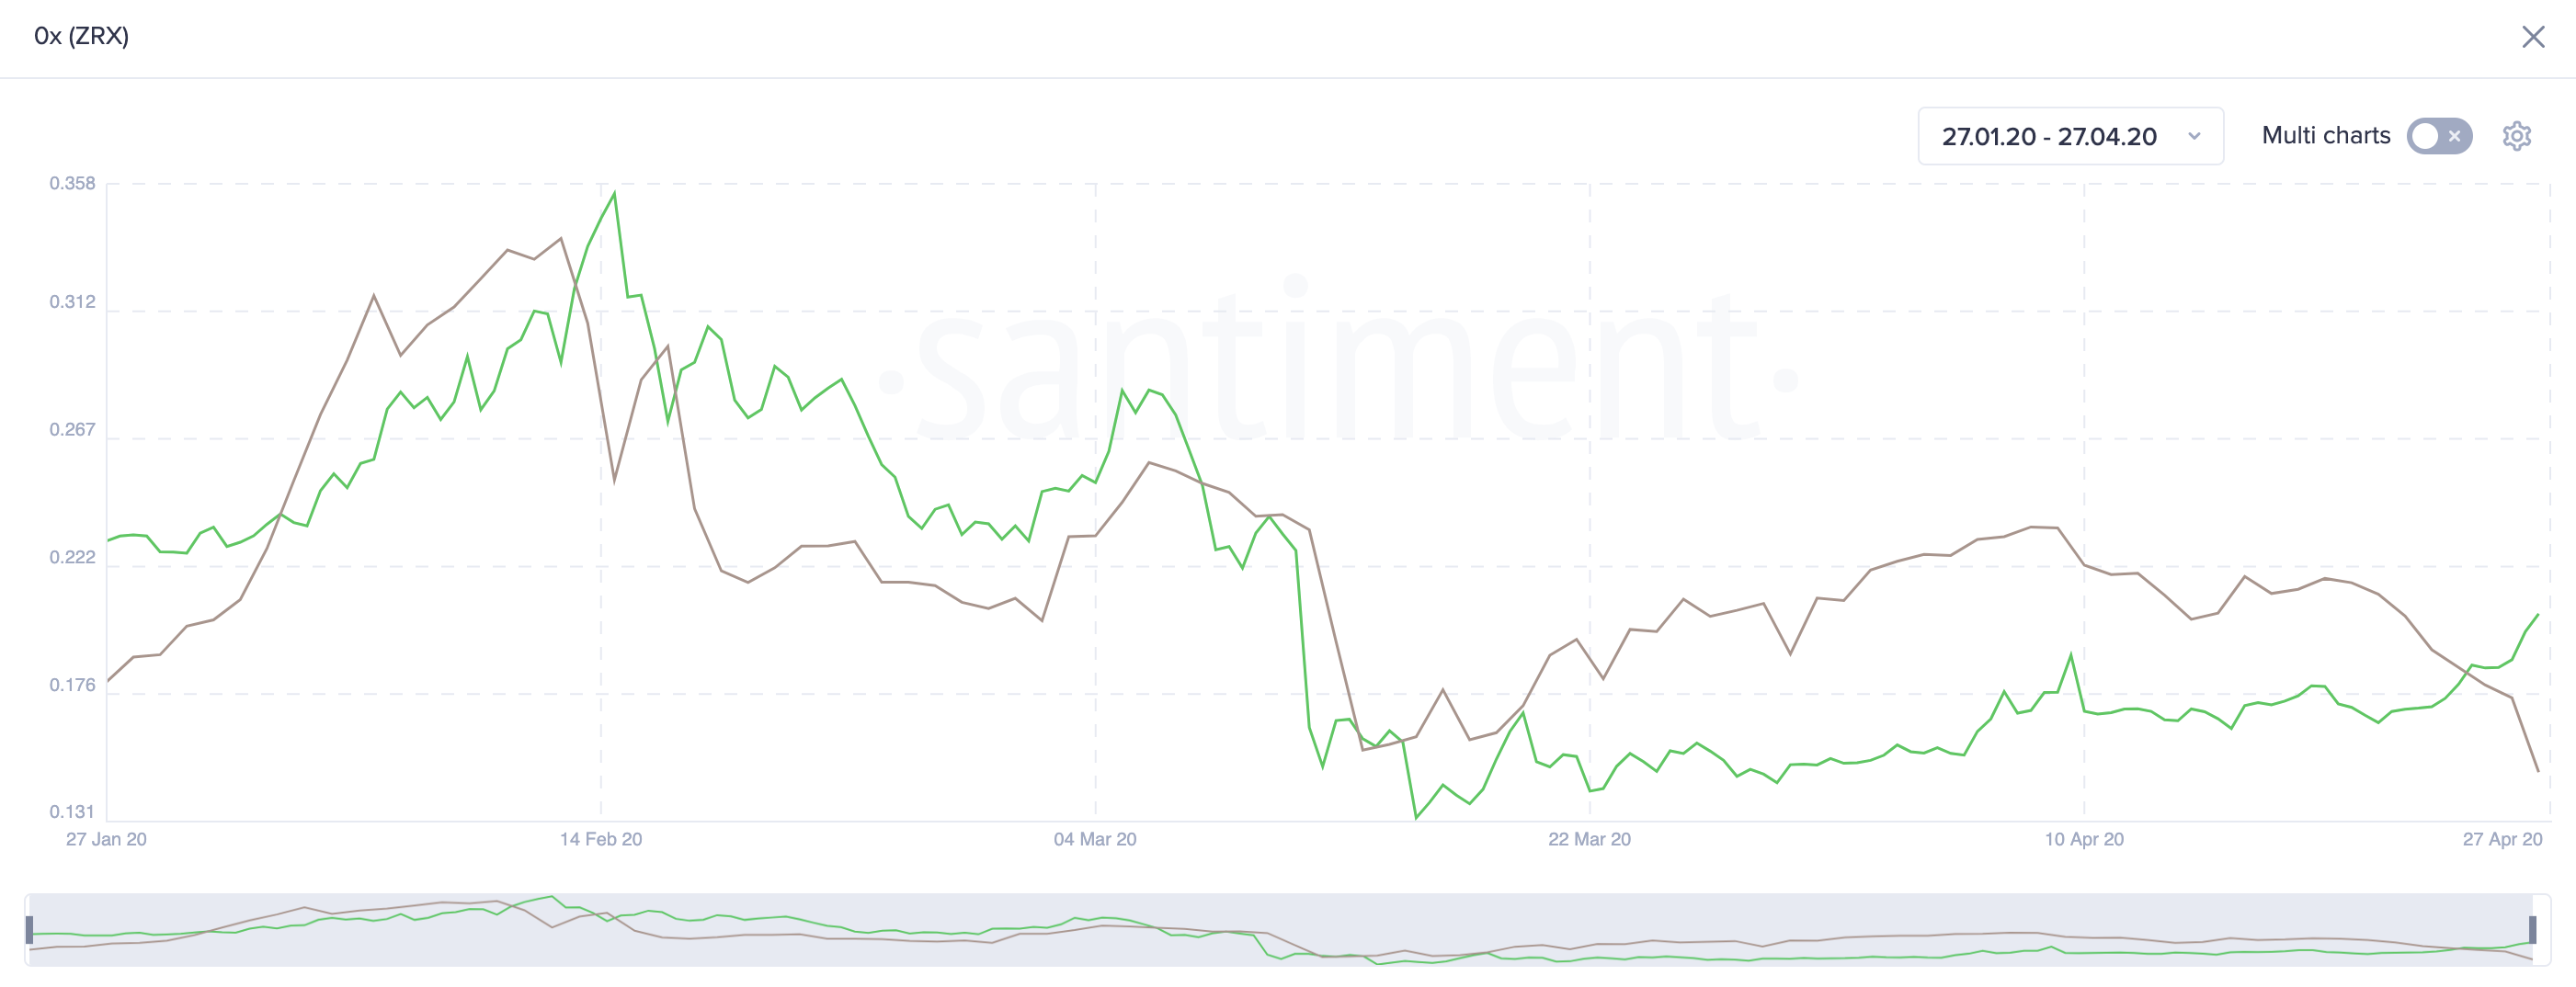
Since the March market meltdown, 0x’s price action led to the formation of an ascending triangle in its 4-hour chart. A horizontal trendline developed along with the swing highs while a rising trendline was created along with the swing lows.
The bullish impulse that ZRX has experienced over the past 12 hours took its price up over 13%. This substantial upswing allowed the open-source altcoin to break out of its ascending triangle.
Now, the continuation pattern estimates that 0x has the potential to advance 32.5%, which could see it rise towards $0.26.
This target is determined by measuring the height of the triangle at its thickest point and adding that distance to the breakout point.
Although 0x appears to have more gas in the tank, the supply of tokens held in cryptocurrency exchanges suggests otherwise.
Over the past month, each time the number of tokens stored in known exchange wallets decreased while the price of ZRX rose, an exhaustion point came right after.
If history repeats itself, 0x might go through a short-lived correction before it hits the target presented by the ascending triangle mentioned before.
IntoTheBlock’s “In/Out of the Money Around Price” (IOMAP) model shows that a bearish impulse would likely be contained by the supply wall that lays around $0.19.
Here, approximately 2,220 addresses bought 37.8 million ZRX.
Such an important support barrier could also serve as a buy zone for sidelined investors who are looking to profit from 0x’s next major price move.
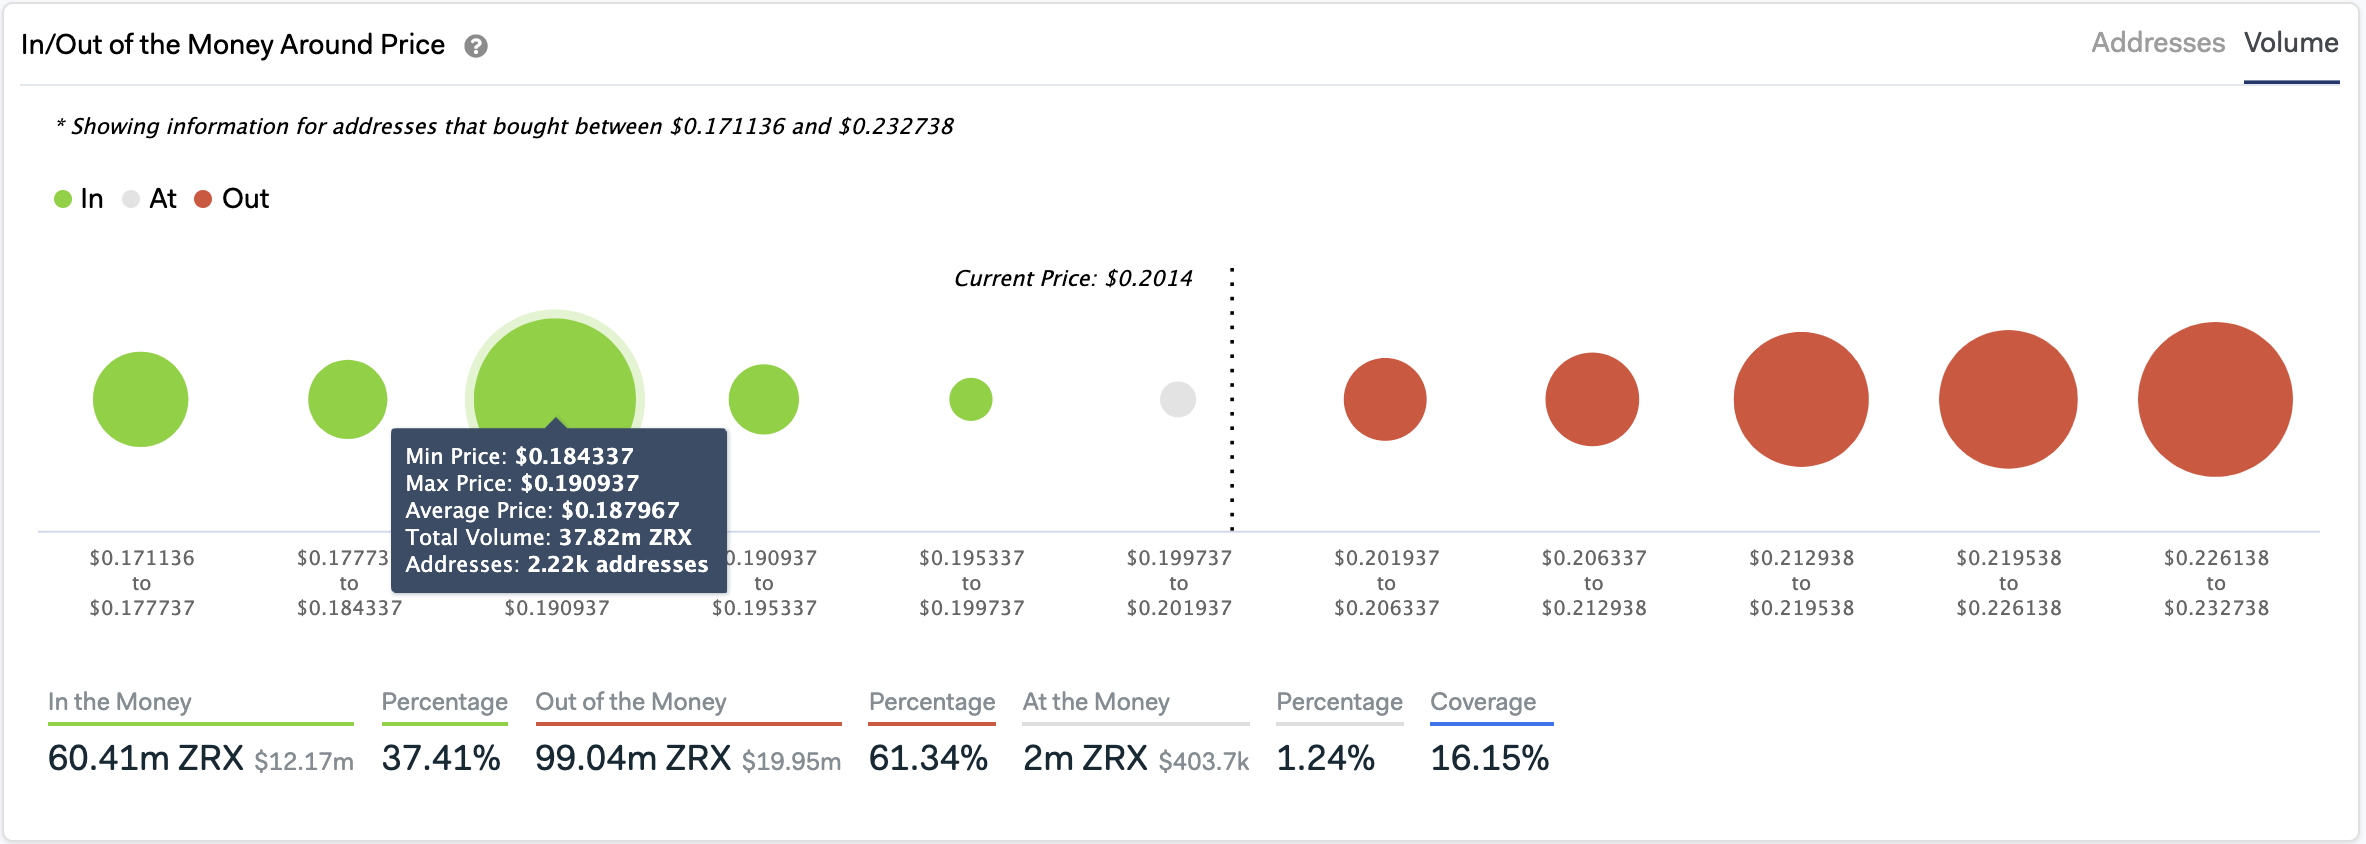
An eventual correction towards the $0.19 support level can be considered healthy for the ascending triangle that 0x has been forming.
Indeed, assets tend to return to the breakout point before continuing their ascent to meet their respective targets.
Nonetheless, an increase in the selling pressure behind ZRX may have the ability to invalidate the ascending triangle.
Closing below the hypotenuse at around $0.17, may see this cryptocurrency plunge to $0.14 or lower.
Kyber Network Is Bound for a Correction
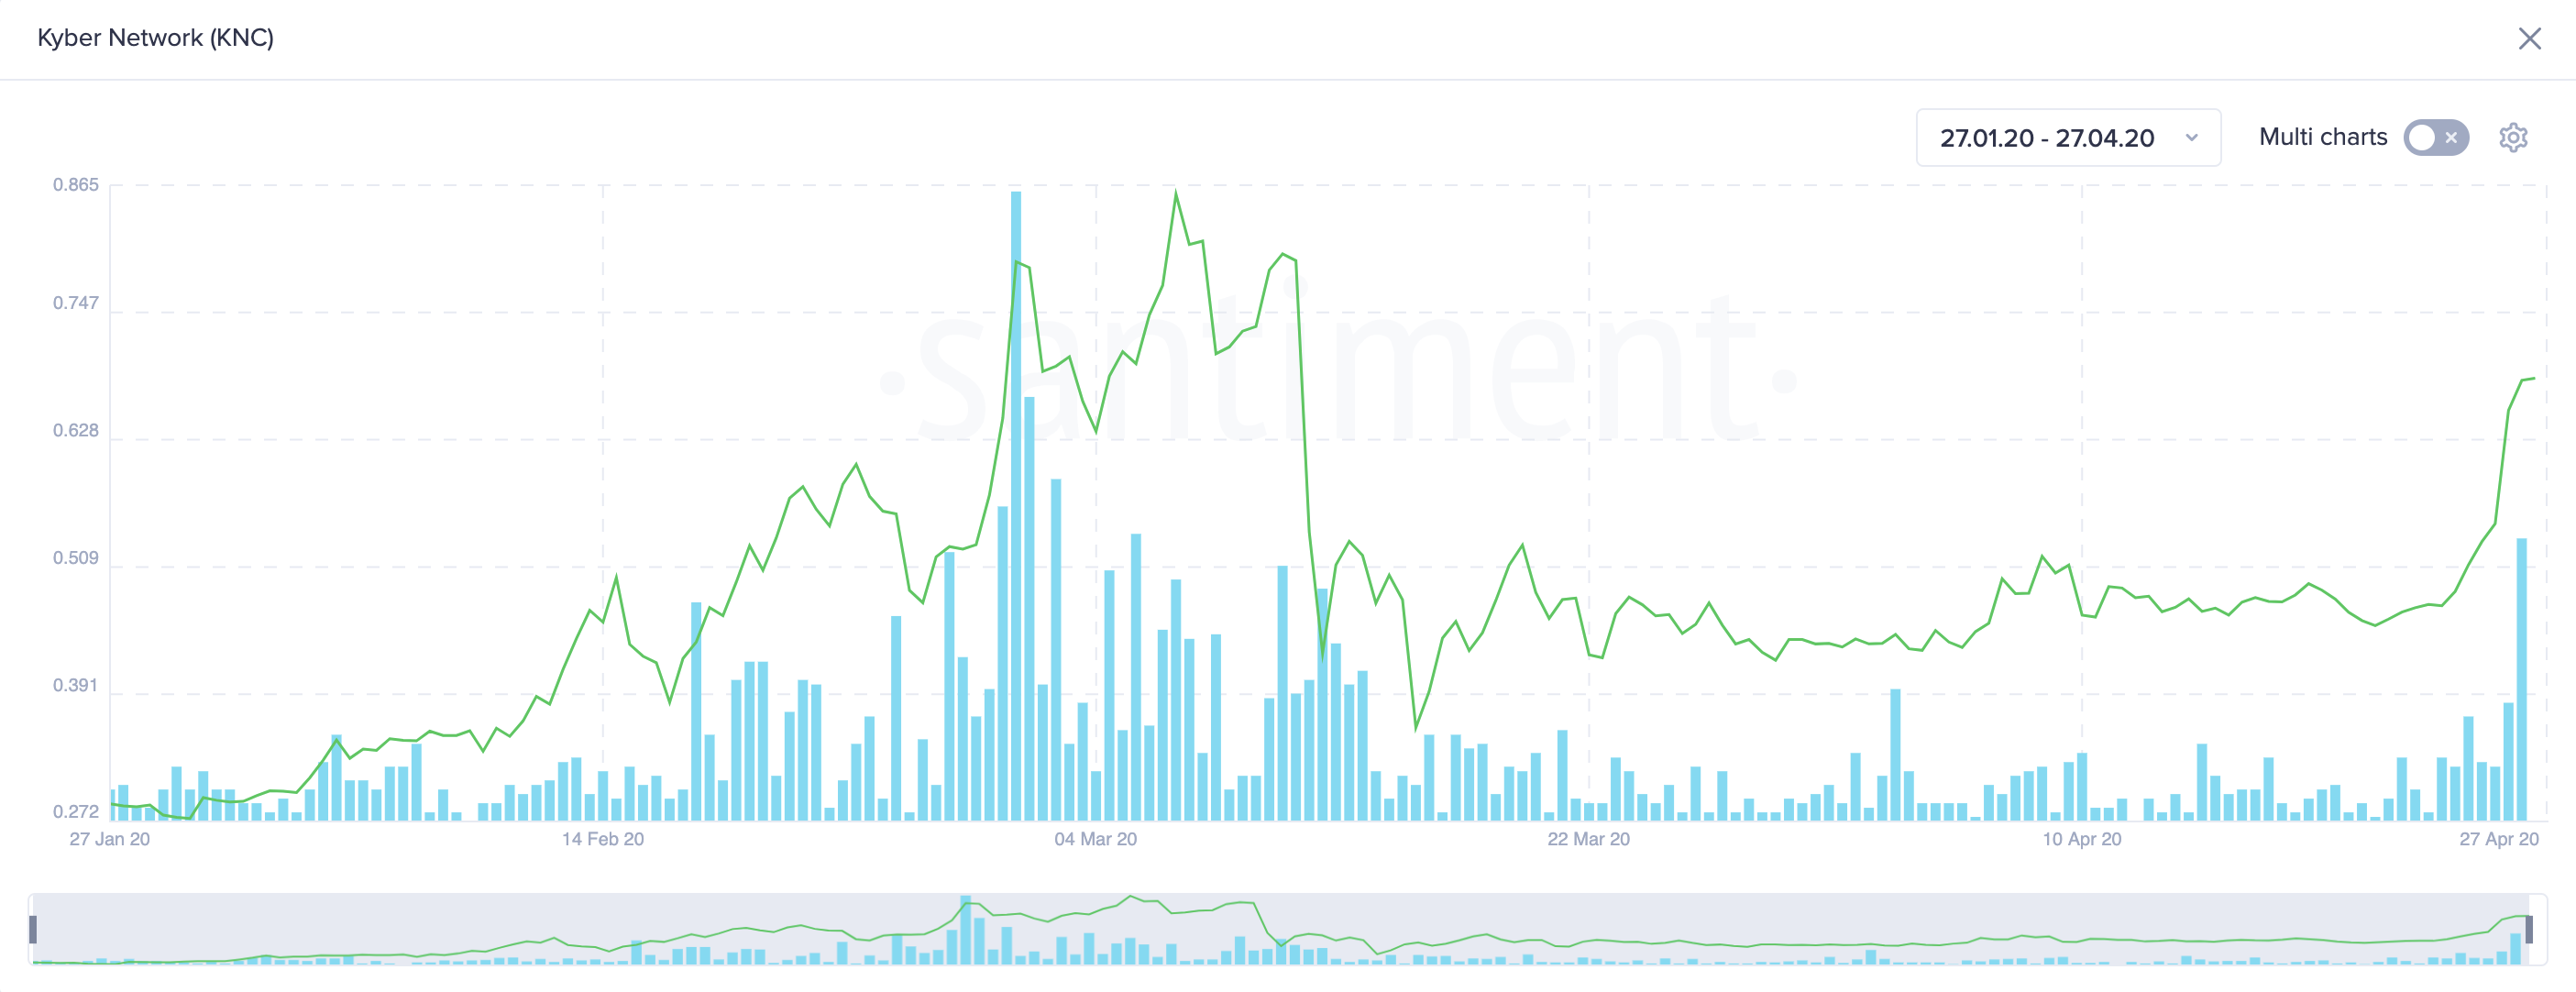
Since the beginning of the year, Kyber Network has secured its place as a top-tier DEX with liquidity and optimal prices. The continued growth has been reflected in the price of KNC, which has managed to surge a whopping 323% since then.
Like the rest of the market, Kyber was also affected by Black Thursday. However, over the past few weeks this altcoin recovered most of its losses and is currently trading around $0.7.
Now, the TD sequential indicator suggests that KNC could have reached an exhaustion point and is bound for a retracement.
This technical index presented a sell signal in the form of a green nine candlestick on the 12-hour chart. Such a bearish formation forecasts a one to four candlesticks correction before the continuation of the uptrend.
Adding to the bearish outlook, Santiment stated that Kyber is reaching a critical level based on public sentiment metrics.
Usually, high points in public discourse are indicative of “local tops.”
“KNC is the altcoin that is getting its current month-high of enthusiasm by the community, so we would not be surprised to see a local top forming very soon,” said Santiment.
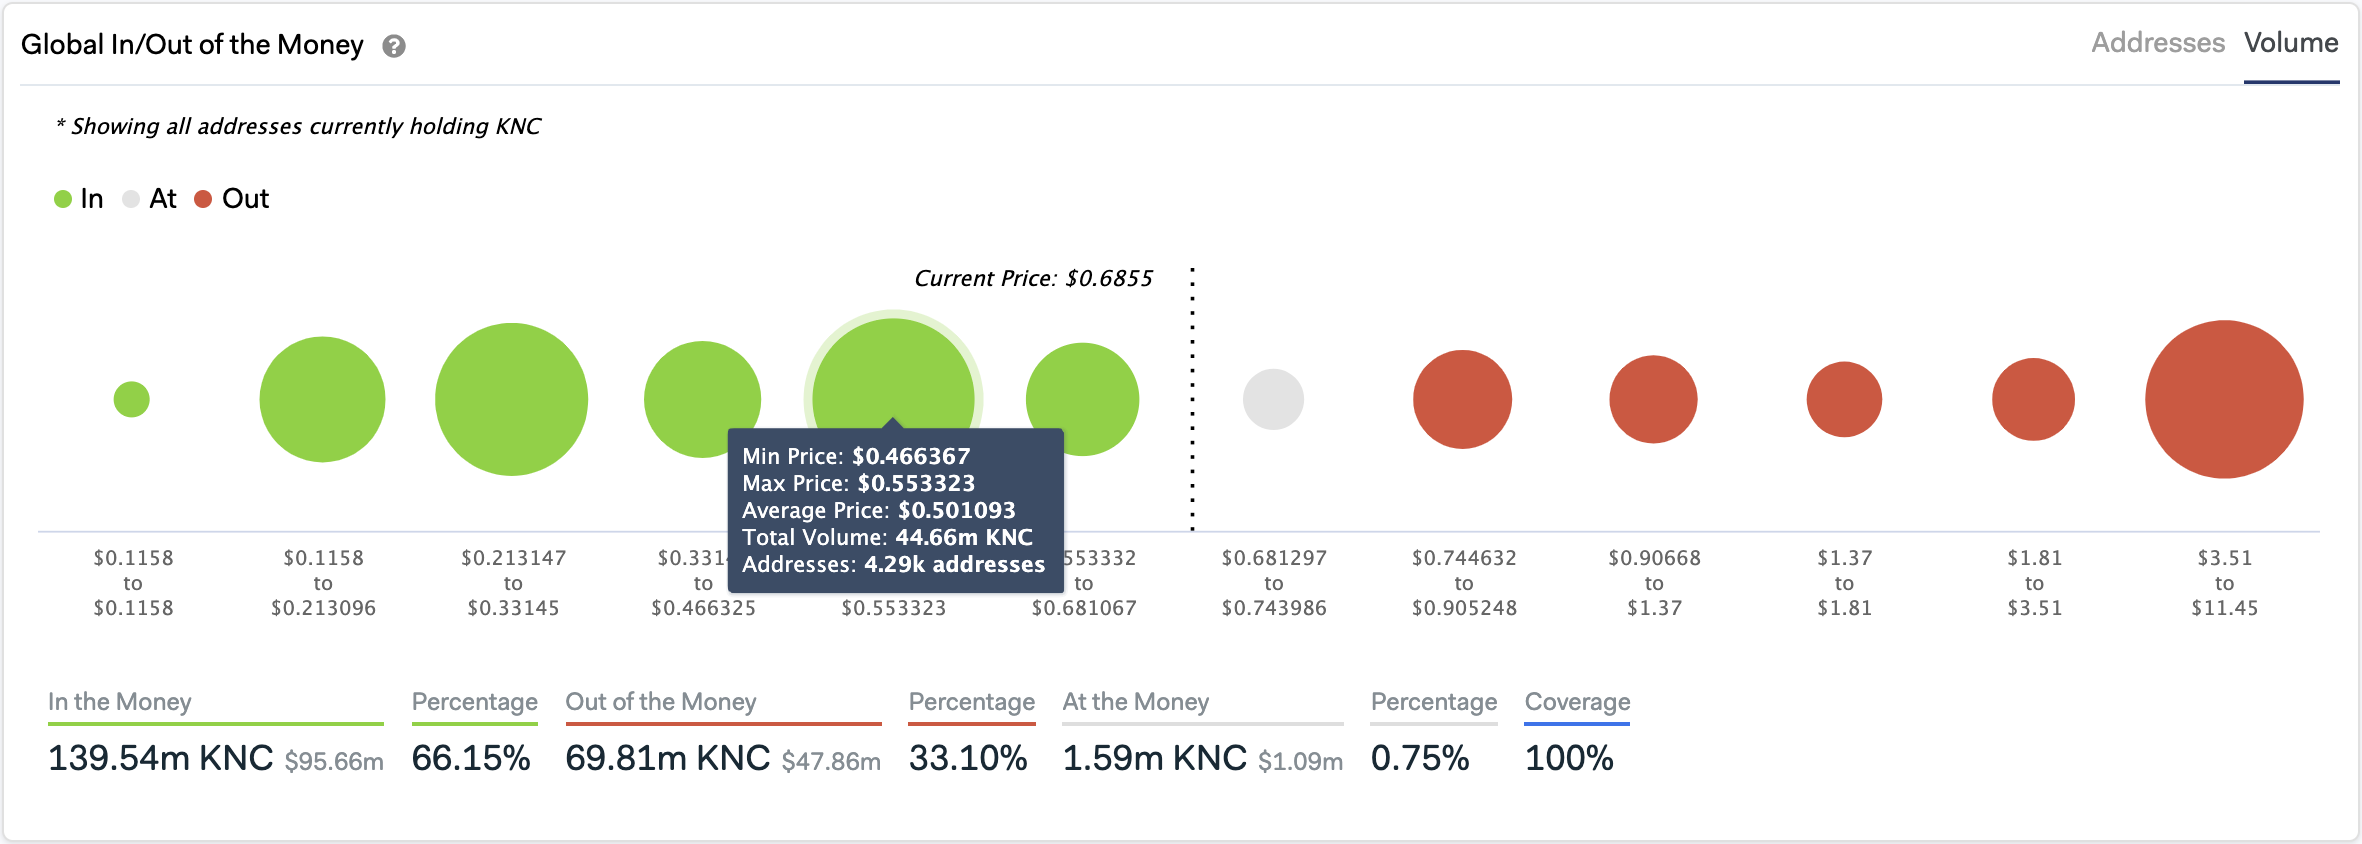
If Kyber Network is indeed poised for a correction, IntoTheBlock’s Global In/Out of the Money model sees a significant support level ahead.
This fundamental index reveals that nearly 4,300 addresses bought 44.7 million KNC at an average price of $0.5. The massive support barrier could prevent this altcoin from a further downturn.
Overall Sentiment
The Crypto Fear and Greed Index is indicating a shift in sentiment among market participants. In the last 24 hours, investors have moved from “extreme fear” to “fear.”
This is a clear sign that confidence is growing as Bitcoin’s halving approaches.
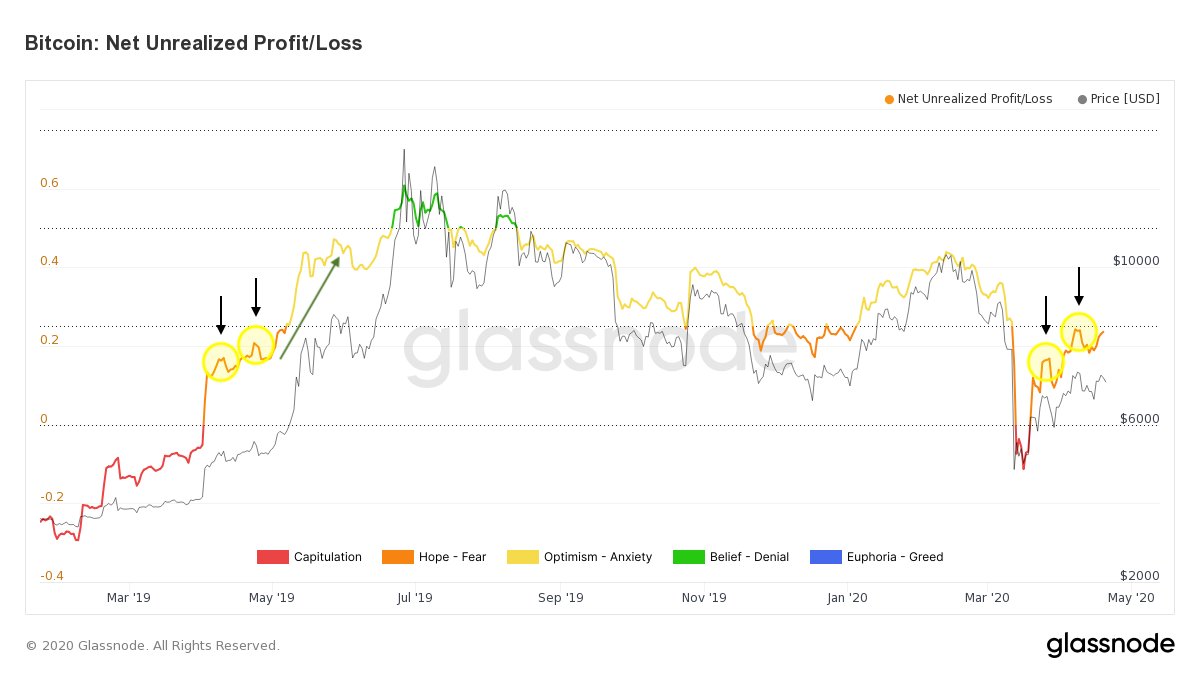
This coincides with Glassnode’s Net Unrealized Profit/Loss indicator, which is currently signaling that Bitcoin has moved back to the “optimism” zone.
The on-chain insights provider maintains that, “a breakout into this zone usually signifies increased investor confidence and can lead to further price gains.”
Even though the altcoins previously analyzed are signaling that a correction is underway, such a bearish impulse could be the catalyst of the next upswing.
As sidelined investors re-enter the market, the new inflow of capital could push prices further up.