
Decred Price Analysis DCR / USD: Bullish Reversal
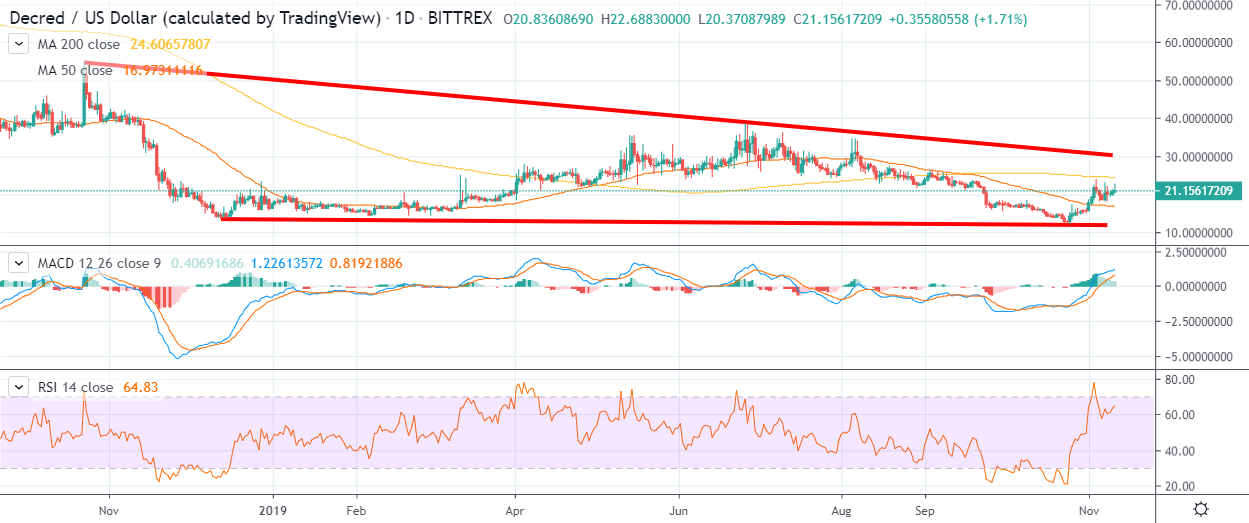
DCR has recovered about 100% from its 2019 trading low.
- Decred has a bullish short-term and a bearish medium-term trading outlook
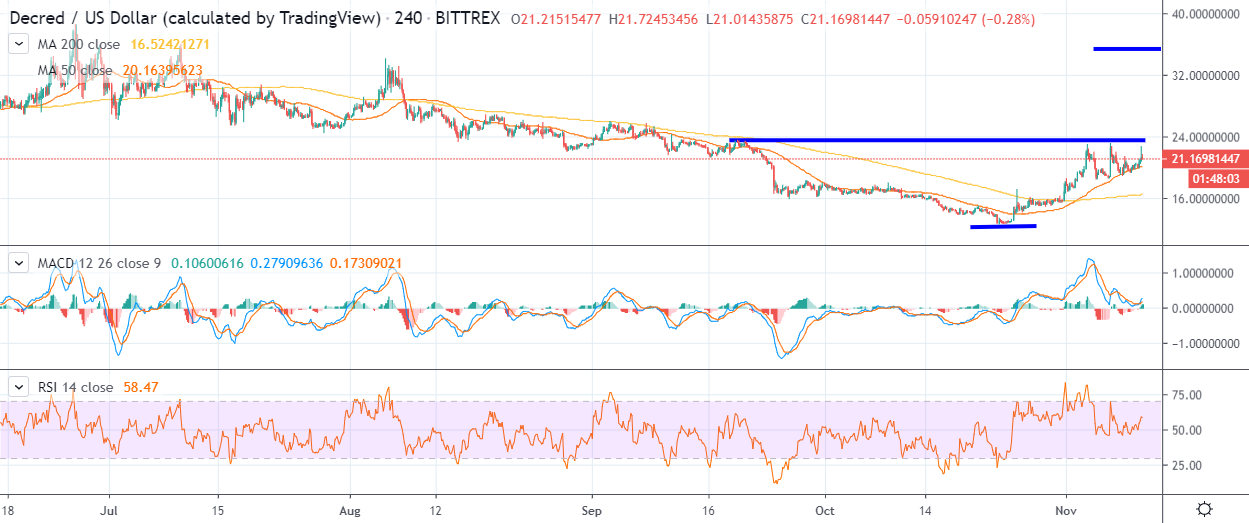
- The four-hour time frame shows that large inverted head and shoulders pattern has formed
- The daily time frame shows a large descending triangle pattern
Decred has been on the rise since Chinese President Xi Jinping’s positive comments towards blockchain and cryptocurrencies, with the DCR / USD pair exploding by around 100% from its 2019 trading low.
The powerful rally has changed the short-term, but not the medium-term outlook for Decred, after the cryptocurrency previously suffered four consecutive months of heavy downside losses.
On a monthly basis the DCR / USD pair has added over thirty-five percent in value and has recently formed a large inverted head and shoulders pattern on the lower time frames.
The bullish inverted head and shoulder pattern shows that if DCR / USD buyers can secure a sustained breakout above the $23.50 resistance level, the cryptocurrency could add a further fifty percent to its trading value.
The daily time frame is showing that the DCR / USD pair is now consolidating in between its 50 and 200-day moving averages, which highly suggests that a medium-term directional breakout is on the horizon.
The daily time frame shows that a descending triangle pattern has formed, with the top of the triangle currently located around the $30.50 resistance level.
Interestingly, the DCR / USD pair’s 200-day moving average is currently located around the $24.50, which is slightly above the neckline of the bullish inverted head and shoulders pattern on the four-hour time frame.
In theory, a rally of around twenty-five percent could occur if buyers force a breakout above the 200-day moving and test towards the top of the descending triangle pattern.
According to the latest sentiment data from TheTIE.io, the short-term sentiment towards Decred is neutral, at 49.00 %, while the overall long-term sentiment towards the cryptocurrency is also bearish, at 33.00%.
Upside Potential
The four-hour time frame shows that a large inverted head and shoulders pattern has formed, with the $23.50 level acting as the neckline of the bullish pattern.
Key technical resistance for the DCR / USD pair above the bullish pattern is currently located at the $24.50 and the $30.50 levels.
Downside Potential
The four-hour time frame is showing that the DCR / USD pair’s 50-period moving average is currently providing the strongest form of short-term technical support, around the $19.50 level.
The daily time frame shows that the DCR / USD pair’s 50-day moving average, located at the $16.50 level, is the strongest form of medium-term support if a deeper decline under the $19.50 level occurs.
Summary
Decred has had a stunning move higher over the last few weeks, placing the cryptocurrency in an attractive technical position.
Continued gains above the $24.50 level could propel the DCR / USD towards the $30.00 level and possibly even higher.
What is the Decred project all about? Find out in our coin guide.
The Simetri team has also published a deep overview in the Decred DARE.