Dent Price Analysis DENT / USD: Long Night Over
Dent price action continues to generate healthy interest.

Share this article
- Dent has a bullish short-term bias, with the cryptocurrency advancing to its highest level since November 2018
- The DENT / USD pair has a strong bullish medium-term trading outlook
- The daily time frame shows that a large inverted head and shoulders pattern has been triggered
Dent / USD Short-term price analysis
The DENT / USD pair has a bullish short-term trading bias, with the cryptocurrency advancing to its highest trading level since November 2018.
The four-hour time frame is showing that an inverted head and shoulders pattern has been triggered, with the bullish pattern already reaching its full upside projection.
Technical indicators on the four-hour time frame remain bullish and continue to generate buy signals.
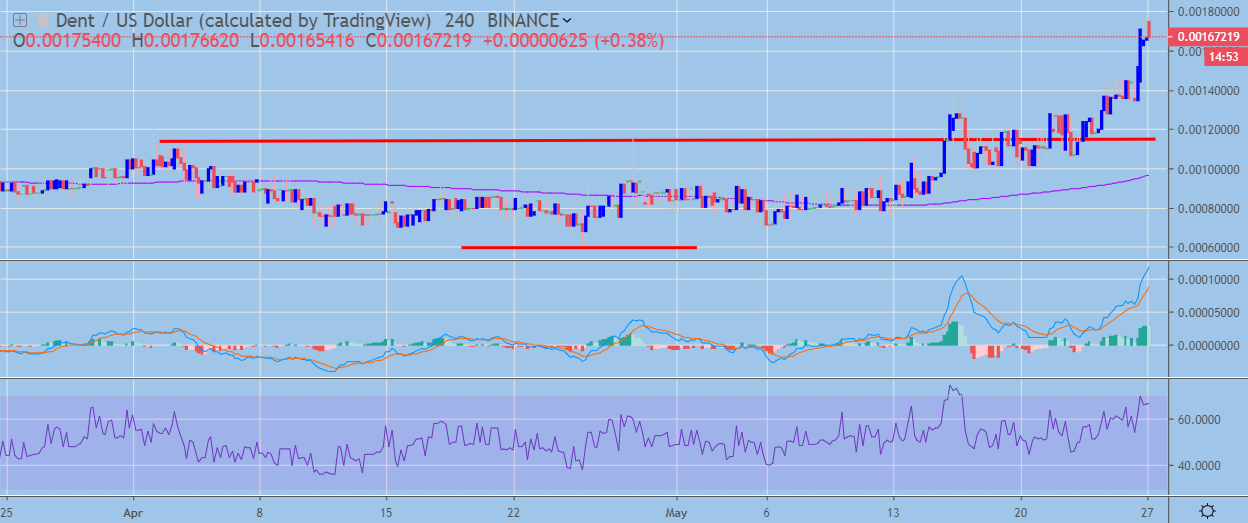 DENT / USD H4 Chart by TradingView
Pattern Watch
Traders should note that the DENT / USD pair may start to correct lower now that the inverted head and shoulders pattern on the four-hour time frame has reached its overall upside objective.
Relative Strength Index
The RSI indicator is bullish on the four-hour time frame, although it is now trading in overbought territory.
MACD Indicator
The MACD indicator on the four-hour time frame is bullish, with both the MACD signal line and histogram issuing buy signals.
Dent / USD Medium-term price analysis
Dent has a bullish medium-term trading outlook, with the cryptocurrency now trading well above its trend defining 200-day moving average.
The daily time frame shows that a large inverted head and shoulders pattern has been triggered, with the cryptocurrency enjoying its second day of strong trading gains.
Technical indicators on the daily time frame are also bullish and continue to generate strong buy signals.
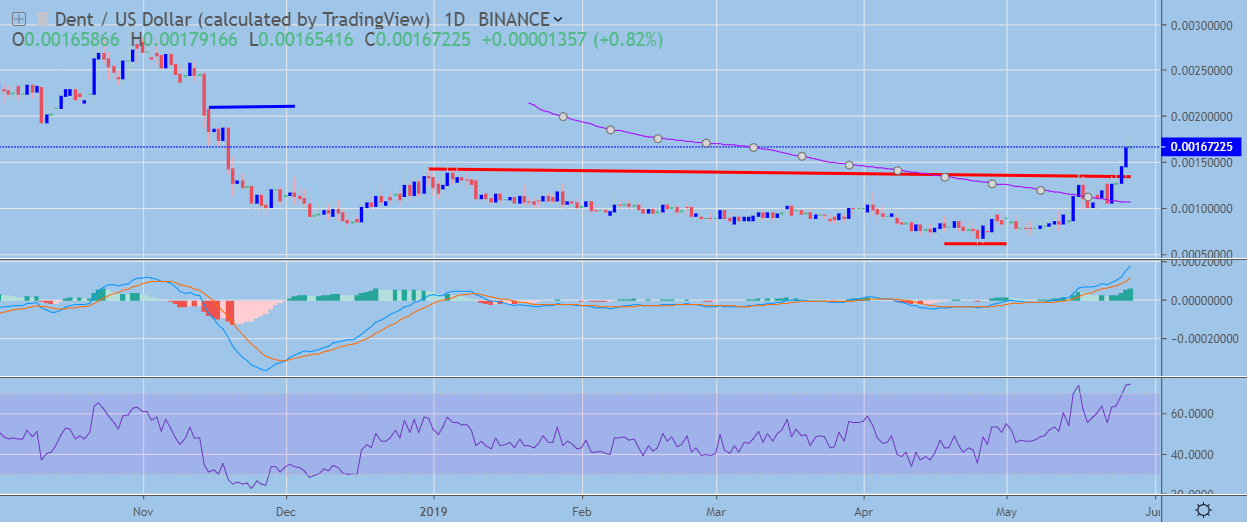 DENT / USD Daily Chart by TradingView
Pattern Watch
Traders should note that the November 14th, 2018 swing high is the overall upside target of the larger inverted head and shoulders pattern on the daily time frame.
Relative Strength Index
The RSI indicator on the daily time frame is bullish, although it has now moved into overbought conditions.
MACD Indicator
The MACD Indicator is bullish on the daily time frame and continues to issue a strong buy signal.
Conclusion
Dent has performed a bullish technical breakout over both time frames, with the cryptocurrency advancing to a new 2019 trading high.
The triggering of the inverted head and shoulders pattern on the daily time frame is now guiding the DENT / USD pair higher, with the November 14th, 2018 swing-high the current bullish target.
Share this article
