 Earn with Nexo

Dogecoin Price Analysis DOGE / USD: Playing Dead
The doge is trapped in a tight price channel.
- Dogecoin has a bearish short-term bias, with the cryptocurrency trading below its 200-period moving average on the four-hour time frame
- The four-hour time frame is showing that a bearish head and shoulders pattern is forming
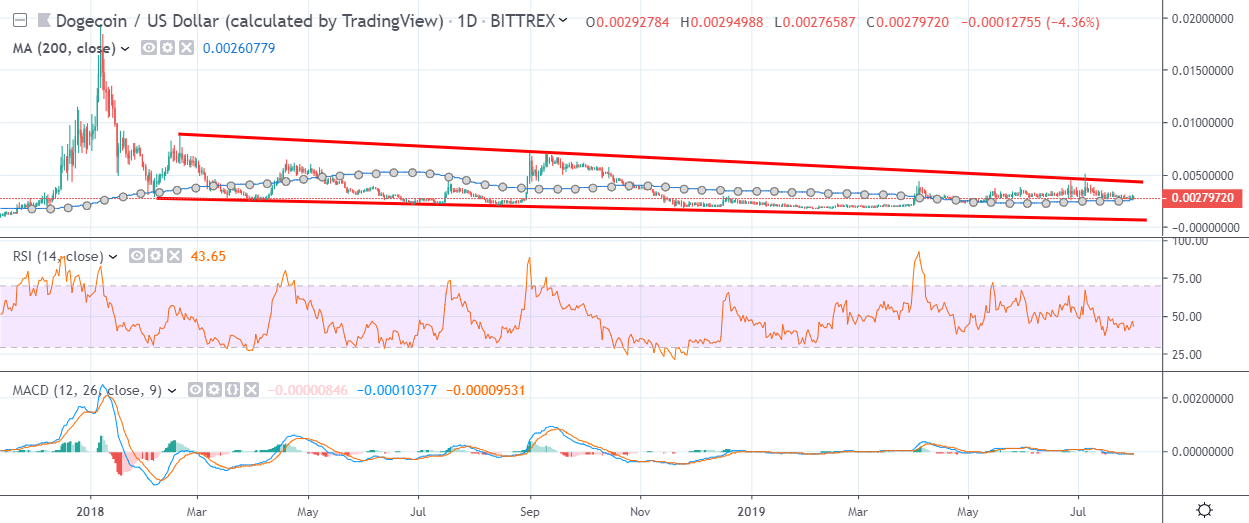
- The daily time frame is showing that the DOGE / USD pair remains trapped within a descending price channel
Dogecoin / USD Short-term price analysis
Dogecoin has a bearish short-term trading bias, with the DOGE / USD pair trading below its 200-period moving average on the four-hour time frame.
The four-hour time frame shows that a bearish head and shoulders is starting to take shape, pointing to further short-term losses for the DOGE / USD pair.
Technical indicators are bearish on the four-hour time frame and continue to issue a sell signal.
Pattern Watch
Traders should note that a corrective move higher may occur in order to complete the bearish pattern.
Relative Strength Index
The RSI indicator is bearish on the four-hour time frame and has a downward trading bias.
MACD Indicator
The MACD indicator on the four-hour time frame is bearish and continues to issue a sell signal.
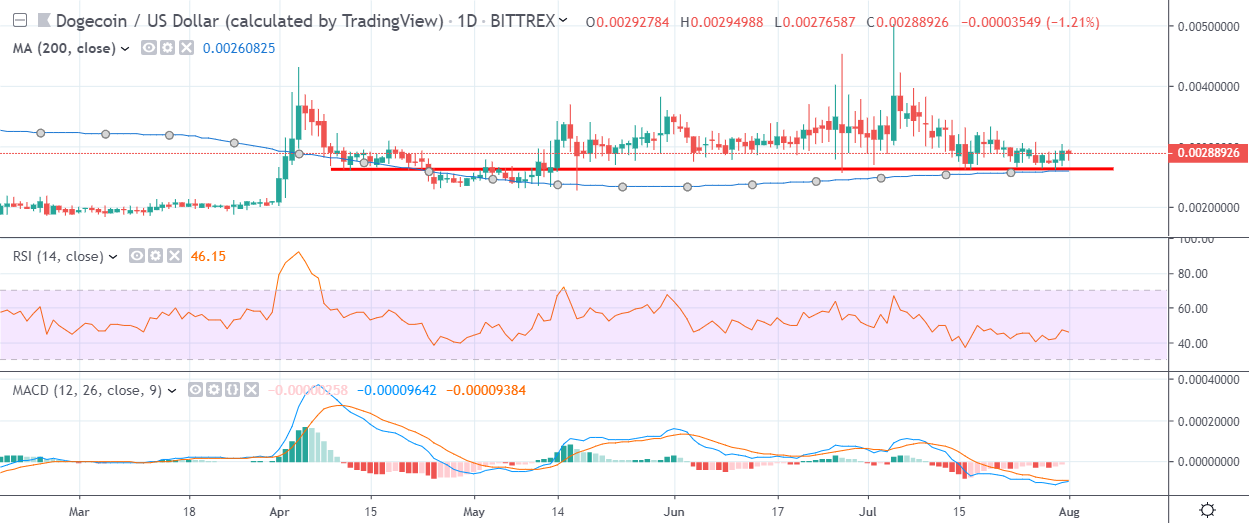
Dogecoin / USD Medium-term price analysis
Dogecoin has a neutral medium-term outlook, with the cryptocurrency consolidating around its trend defining 200-day moving average.
The daily time frame is showing that the DOGE / USD pair has eroded its recent trading gains and remains trapped within a descending wedge pattern.
Technical indicators across the daily time frame have a slight downward trading bias.
Pattern Watch
Traders should note that descending wedge patterns are typically considered to be bullish patterns.
Relative Strength Index
The RSI indicator is trading below neutral and has a bearish bias on the daily time frame.
MACD Indicator
The MACD indicator is flatlined on the daily time frame and is failing to generate a clear trading signal.
Conclusion
Dogecoin is likely to see more downside over the short-term if the bearish head and shoulders pattern starts to unfold over the coming trading sessions.
Continued losses in the near-term are likely to prompt an important technical test of trendline support from the falling wedge pattern on the daily time frame.
Check out Dogecoin in our coin guide.
For a more serious look, our DARE is a great starting point.