 Earn with Nexo

Dogecoin / USD Technical Analysis: A New Bearish Phase
Dogecoin price analysis - DOGE is not recovering from its bearish trend, with prospects looking grim for the popular cryptocurrency.
[vc_row][vc_column][vc_column_text]
- Dogecoin is bearish in the short-term, with price now trading tentatively below the neckline of a bearish head and shoulders pattern
- DOGE / USD is bearish in the medium-term and testing below the neckline of a much larger head and shoulders pattern
- Sellers may soon test the DOGE / USD pair’s 200-week moving average
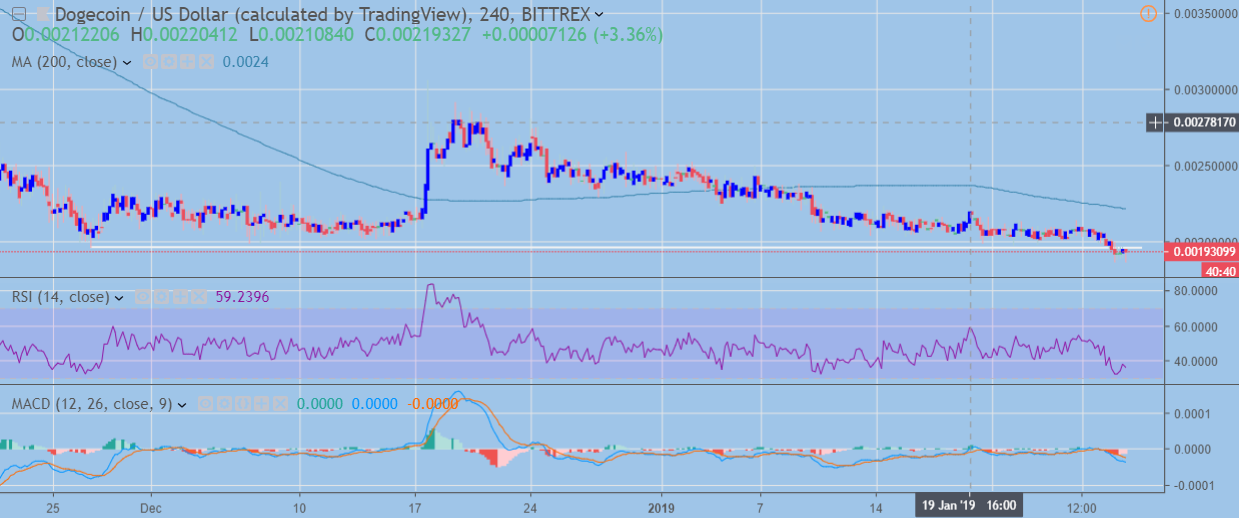
DOGE / USD Short-term price analysis
In the short-term, Dogecoin is bearish with price starting to trade below the neckline of a sizeable head and shoulders pattern.
DOGE / USD has been under almost constant selling pressure since the start of the year, with the pair gradually drifting lower and creating bearish lower highs and lower lows.
If the bearish pattern plays out to its full downside projection, the DOGE / USD pair could shed close to a third of its current value.
Pattern Watch
The head and shoulders pattern should be watched closely in the short-term, as a major technical sell-off may now be underway in the DOGE / USD pair.
 DOGE / USD H4 Chart (Source: TradingvVew)
Key Moving Averages
The 200-period moving average on the four-hour time frame provides a solid upside target if sellers fail to capitalize on the recent break below neckline support.
RSI + MACD Indicators
The RSI indicator remains in oversold territory on the four-hour time frame, while the MACD indicator is currently awaiting the bearish move to take shape below the head and shoulders pattern.
If price starts to fall sharply lower traders should watch the MACD histogram closely.
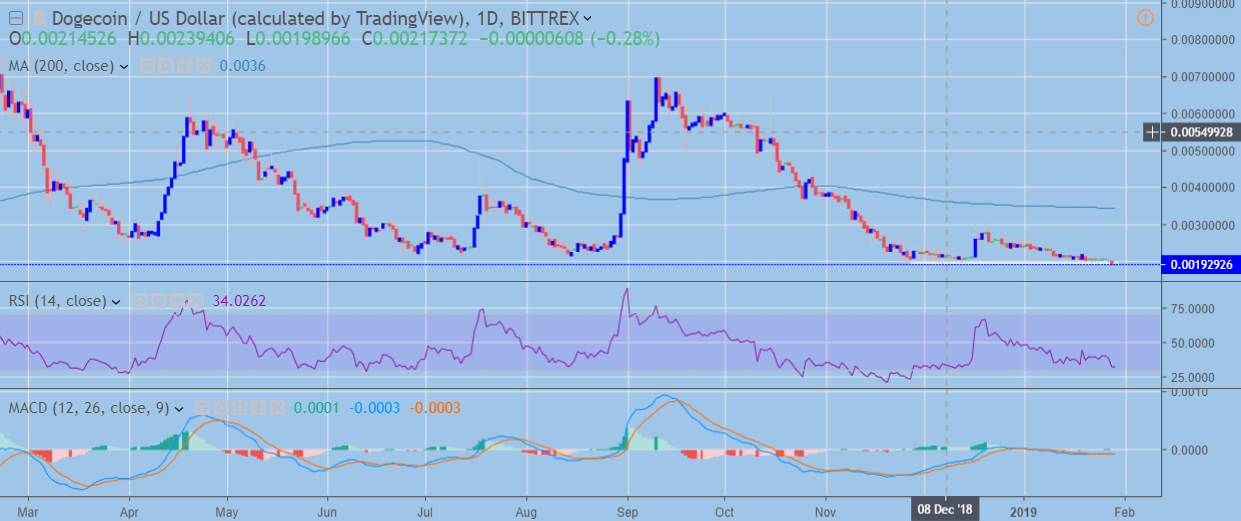
DOGE / USD Medium-term price analysis
Dogecoin is bearish in the medium-term, with the daily time frame chart showing that the DOGE / USD pair is on the cusp of a technical meltdown.
A series of head and shoulders pattern are visible on the daily time frame chart, highlighting the sheer bearishness of the DOGE / USD pair at present.
In terms of major support, the DOGE / USD pair is approaching its key 200-week moving average.
Traders should pay close attention to the 200-week moving average, as a move below this key technical indicator may support a new bearish phase in the cryptocurrency.
 DOGE / USD Daily Chart (Source: TradingView)
Pattern Watch
The series of bearish head and shoulders patterns are the overwhelming theme when looking for consistent price patterns. The DOGE / USD pair is truly at a critical juncture in the medium-term.
RSI + MACD Indicators
The RSI is bearish and approaching oversold trading conditions, while the daily MACD is turning bearish. The histogram is starting to trend lower over the last two trading days, which is consistent with the recent moves in the pair.[/vc_column_text][/vc_column][/vc_row][vc_row][vc_column][vc_column_text][/vc_column_text][/vc_column][/vc_row][vc_row][vc_column][vc_column_text]
Decentral Media, Inc., the publisher of Crypto Briefing, is not an investment advisor and does not offer or provide investment advice or other financial advice. Nothing on this website constitutes, or should be relied on as, investment advice or financial advice of any kind. Specifically, none of the information on this website constitutes, or should be relied on as, a suggestion, offer, or other solicitation to engage in, or refrain from engaging in, any purchase, sale, or any other any investment-related activity with respect to any transaction. You should never make an investment decision on an investment based solely on the information on our website, and you should never interpret or otherwise rely on any of the information on this website as investment advice. We strongly recommend that you consult a licensed investment advisor or other qualified financial professional if you are seeking investment advice on an investment.
[/vc_column_text][/vc_column][/vc_row]