
EOS / USD Technical Analysis: Preparing For The Test
EOS / USD Technical Analysis - The pair's current outlook is neutral in the medium-term, but there's a major bullish test approaching.
[vc_row][vc_column][vc_column_text]
- EOS is bullish in the short-term with the pair showing multiple buy signals
- The medium-term outlook is currently neutral with price approaching a major technical test
- Technical indicators across the short-term are starting to look overstretched
EOS / USD Short-term price analysis
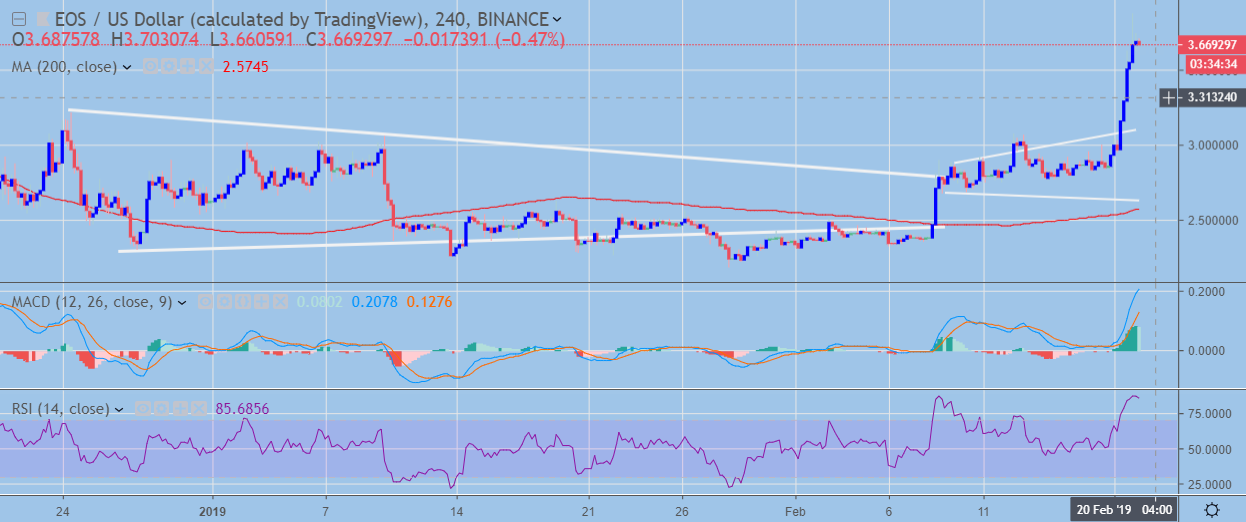
In the short-term, EOS is bullish with the four-hour time frame showing a major technical breakout underway.
The four-hour time frame currently shows price trading above the neckline of a large inverted head and shoulders pattern, we can also see that the EOS / USD pair has broken out from a neutral triangle pattern and a broadening wedge pattern on the same time frame.
Some caution is advised, as technical indicators on the four-hour time frame are starting to appear overstretched.
 EOS / USD H4 Chart (Source: TradingView)
Pattern Watch
The bullish inverted head and shoulders pattern should be the key driver for further gains in the EOS / USD pair over the short-term.
MACD
The MACD indicator is bullish, although the histogram shows signs that the indicator is becoming overstretched.
Relative Strength Index
The RSI indicator has now reached overbought conditions on the four-hour time frame.
EOS / USD Medium-term price analysis
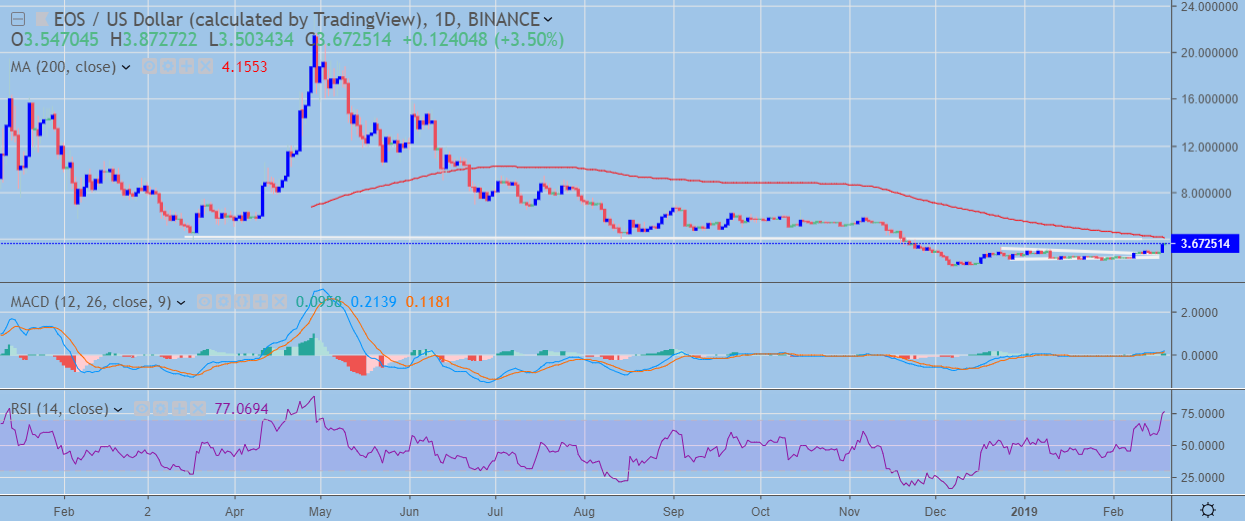
EOS is neutral in the medium-term, with the cryptocurrency shifting its bearish bias by moving to a fresh 2019 trading high.
The EOS / USD pair is approaching the neckline of a large head and shoulders pattern that price has been trading under since November last year.
Similarly, the pair is also approaching its 200-day moving average, which the cryptocurrency has been trading below since June last year.
If bulls can break above the dual resistance area on the daily time frame, the EOS / USD will start to turn bullish over the medium-term.
 EOS / USD H4 Chart (Source: TradingView)
Pattern Watch
Traders should watch for a sustained break above the head and shoulders pattern on the daily time frame as it may be a game changer for the EOS / USD pair over the medium-term.
MACD
The MACD indicator on the daily time frame has turned bullish and shows scope for further upside in the EOS / USD pair on the mentioned time frame.
Relative Strength Index
The Relative Strength Index has turned bullish on the daily time frame, although it is approaching overbought conditions.
Conclusion
The recent surge higher in the EOS pair has significantly shifted the cryptocurrencies technical outlook. The EOS / USD pair may start to break higher over the medium-term due to its improving technicals and the presence of a bullish inverted head and shoulders pattern.
A minor pullback in the short-term may occur due to indicators on the four-hour time appearing overstretched.
Decentral Media, Inc., the publisher of Crypto Briefing, is not an investment advisor and does not offer or provide investment advice or other financial advice. Nothing on this website constitutes, or should be relied on as, investment advice or financial advice of any kind. Specifically, none of the information on this website constitutes, or should be relied on as, a suggestion, offer, or other solicitation to engage in, or refrain from engaging in, any purchase, sale, or any other any investment-related activity with respect to any transaction. You should never make an investment decision on an investment based solely on the information on our website, and you should never interpret or otherwise rely on any of the information on this website as investment advice. We strongly recommend that you consult a licensed investment advisor or other qualified financial professional if you are seeking investment advice on an investment.
[/vc_column_text][/vc_column][/vc_row]