ETH / USD Price Analysis: Readying For Attack
Ethereum is recovering its price, with bulls seemingly preparing to test the $200 level.

Share this article
- Ethereum has a bullish short-term trading bias, with the ETH / USD pair recovering back above its 200-period moving average on the four-hour time frame
- ETH has an increasingly bullish medium-term trading outlook
- The daily time frame continues to show a bullish inverted head and shoulders pattern in play
Ethereum / USD Short-term price analysis
ETH has a bullish short-term trading bias, with the cryptocurrency recovering back above its 200-period moving average on the four-hour time frame.
The four-hour time frame shows that buyers have invalidated the bearish head shoulders pattern, while the recent advance creating a bullish inverted head and shoulders pattern.
Technical indicators on the four-hour time frame are currently mixed and failing to generate a clear trading signal.
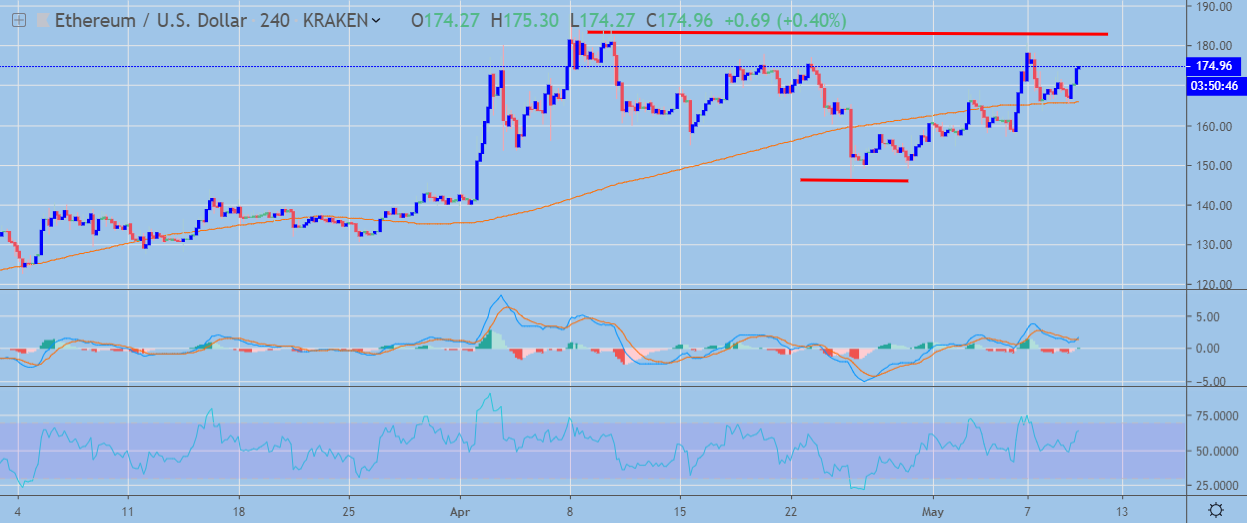 ETH / USD H4 Chart by TradingView
Pattern Watch
Traders should note that the upside target of the bullish inverted head and shoulders pattern on the four-hour time frame would take the ETH / USD pair towards the $220.00 level.
Relative Strength Index
The RSI indicator on the four-hour time frame has turned bullish and shows scope for further upside.
MACD Indicator
The MACD indicator on the four-hour time frame is conflicted and currently failing to generate a clear trading signal.
Ethereum / USD Medium-term price analysis
ETH has an increasingly bullish medium-term trading bias, with the ETH / USD pair still trading above its trend defining 200-day moving average.
The daily time frame is showing that the bullish breakout above the neckline of the inverted head and shoulders pattern is still underway, with the $165.00 level now acting as a crucial pivot point.
Technical indicators on the daily time frame are bullish and show scope for further upside.
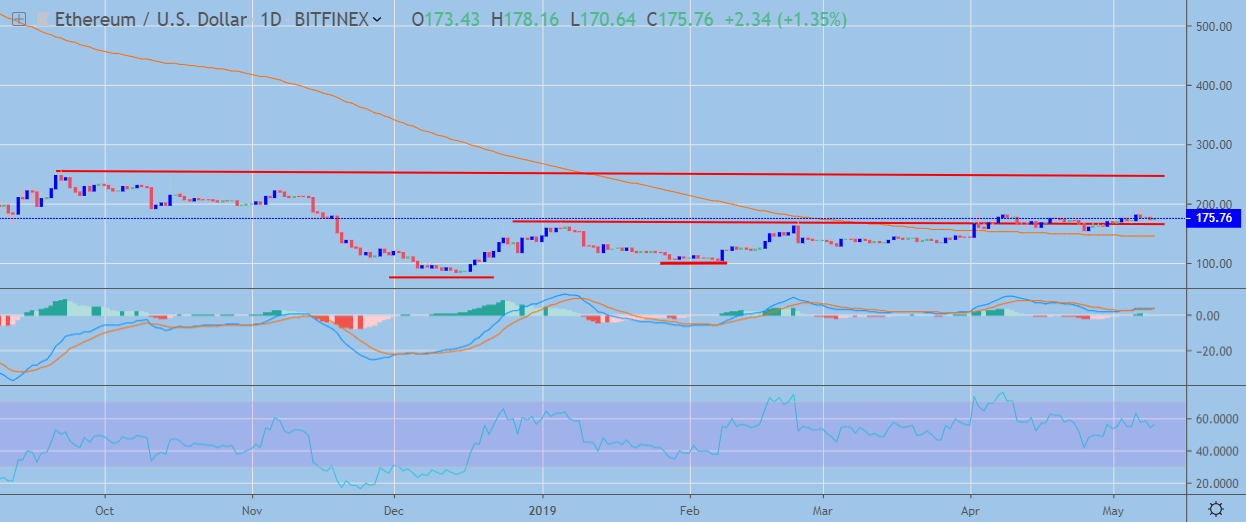
ETH / USD Daily Chart by TradingView
Pattern Watch
Traders should note that if the inverted head and shoulders pattern reaches its upside projection then an even larger bullish pattern will start to form on the daily time frame.
Relative Strength Index
The RSI Indicator on the daily time frame remains bullish and shows scope for further upside.
MACD Indicator
The MACD indicator on the daily time frame is currently neutral and failing to generate a clear trading signal.
Conclusion
The recent invalidation of the bearish pattern on the four-hour time frame offers a strong indication that the ETH / USD pair may be preparing to attack the $200.00 resistance level, while the bullish pattern on the daily time frame also suggests that the ETH / USD could eventually target the $265.00 resistance level.
Check out our Ethereum coin guide here.
Share this article
