Ethereum Could Be on the Verge of New All-Time Highs
Ethereum looks bullish as resistance weakens.

Key Takeaways
- Ethereum is up more than 10% in the last 30 hours.
- A decisive close above $3,806 could push ETH to new all-time highs.
- Prices might test resistance at $4,380 before rising to $6,000.
Share this article
With more than $30 billion worth of Ethereum out of circulation, it appears that prices may be about to experience a supply shock. Still, ETH has at least one barrier to overcome before it can hit new all-time highs.
Ethereum Faces One Last Resistance
Ethereum looks like it may be primed for a breakout despite the significant gains recently incurred.
The second-largest cryptocurrency by market cap has enjoyed bullish price action in the past 30 hours. It surged by more than 10%, going from a low of $3,470 to hit a high of $3,825.
The sudden upward pressure has pushed Ethereum toward a critical resistance cluster. The Tom DeMark (TD) Sequential’s risk line, in unison with the 78.6% Fibonacci retracement level at $3,806, is acting as an important obstacle that ETH must overcome to advance further.
Ethereum’s daily chart reveals that a break of the TD setup’s risk line has typically led to significant bullish impulses. For instance, ETH surged by more than 17% on Sep. 1 after slicing through this hurdle. Similar price action took place on Aug. 4 as Ether gained over 25% in market value once it overcame this barrier.
Given the lack of any resistance levels ahead of $3,806, it is reasonable to assume that a daily candlestick close above it could result in a breakout. Ethereum could then rise to retest the mid-May all-time high of $4,380, or even enter price discovery mode and target $6,000.
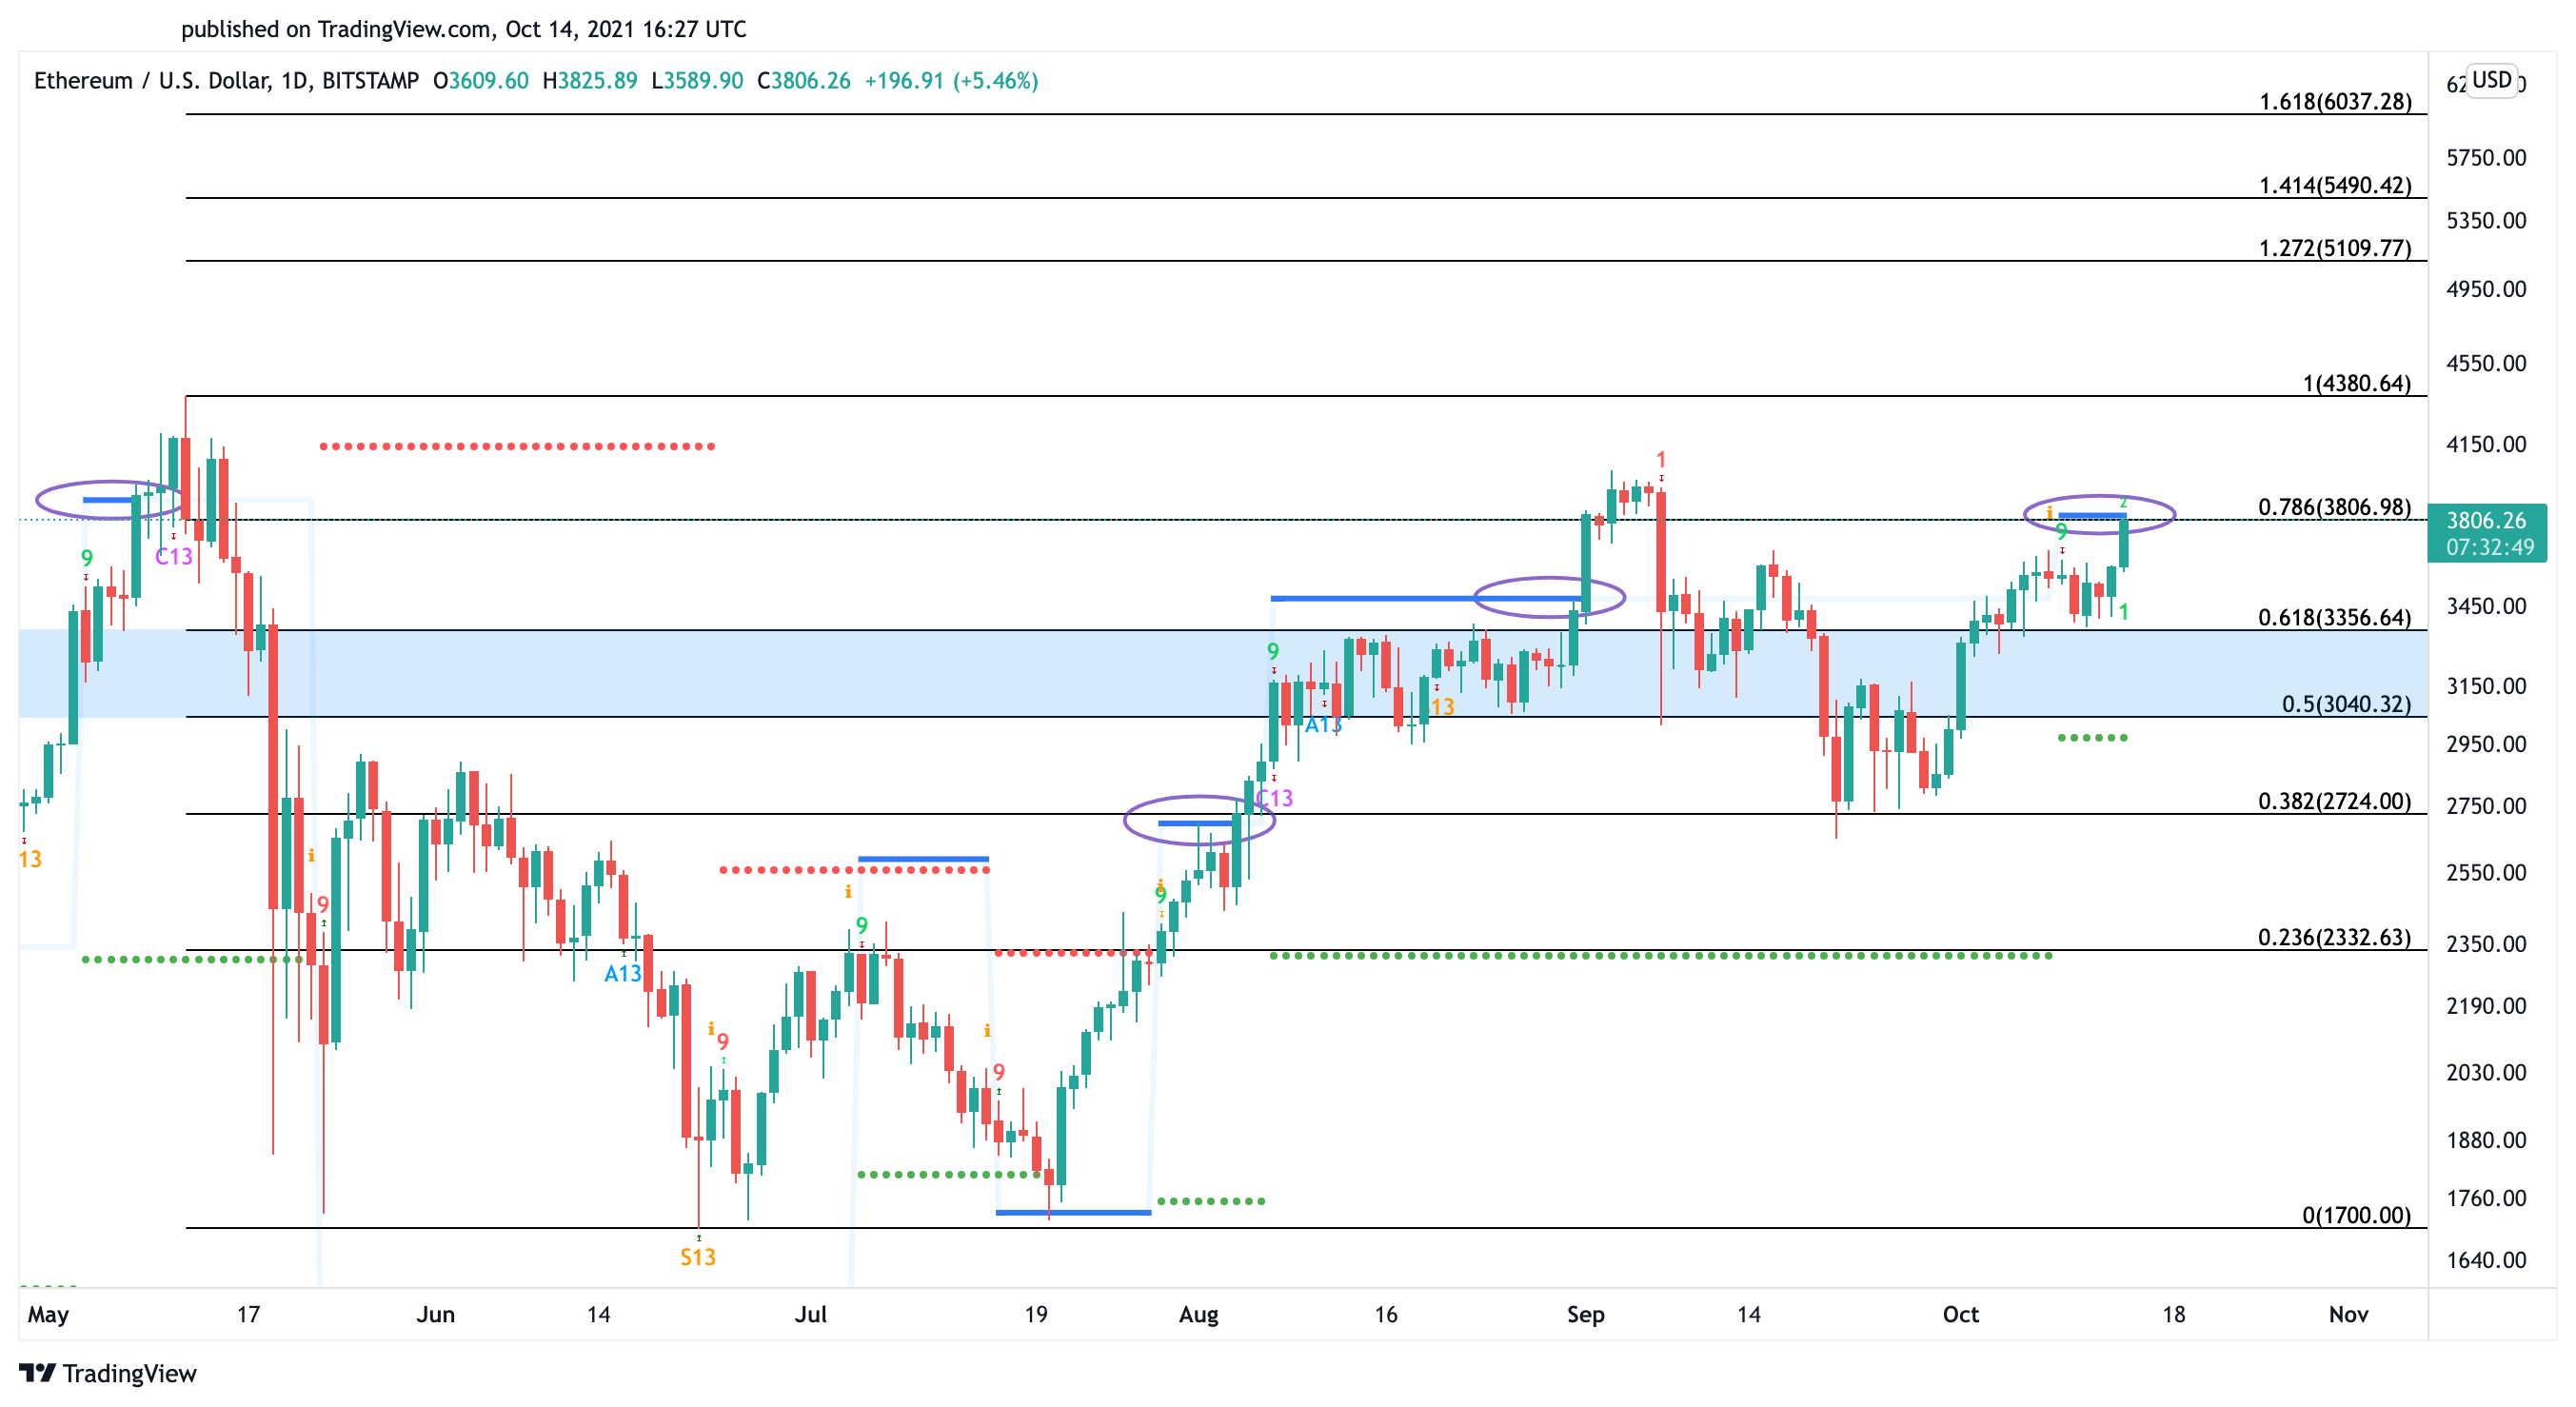
Wise investors might now wait for a decisive close above the TD’s risk line before entering any bullish trades. Failing to break through this resistance level could instead lead to a considerable correction as the following critical levels of support are represented by the 61.8% or 50% Fibonacci retracement level. These demand zones sit at $3,356 and $3,040, respectively.
Share this article
