 Earn with Nexo

Ethereum Price Analysis ETH / USD: False Hope
ETH risks falling under the $200 level.
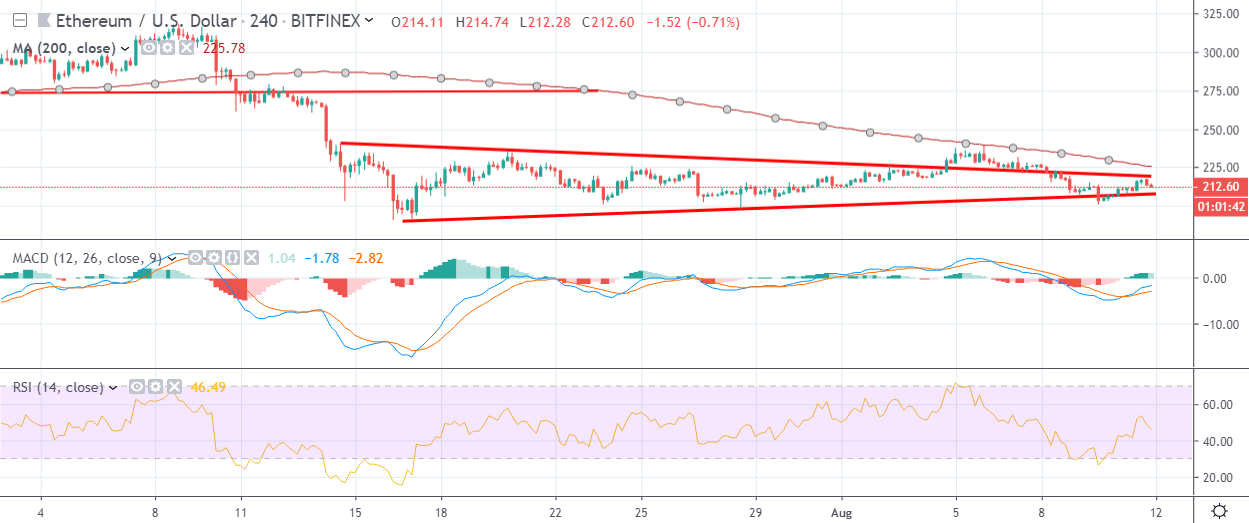
- Ethereum has a bearish short-term bias, with the ETH / USD pair still trading below its 200-period moving average on the four-hour time frame
- The four-hour time frame shows that price has moved back inside a triangle pattern after a false bullish breakout
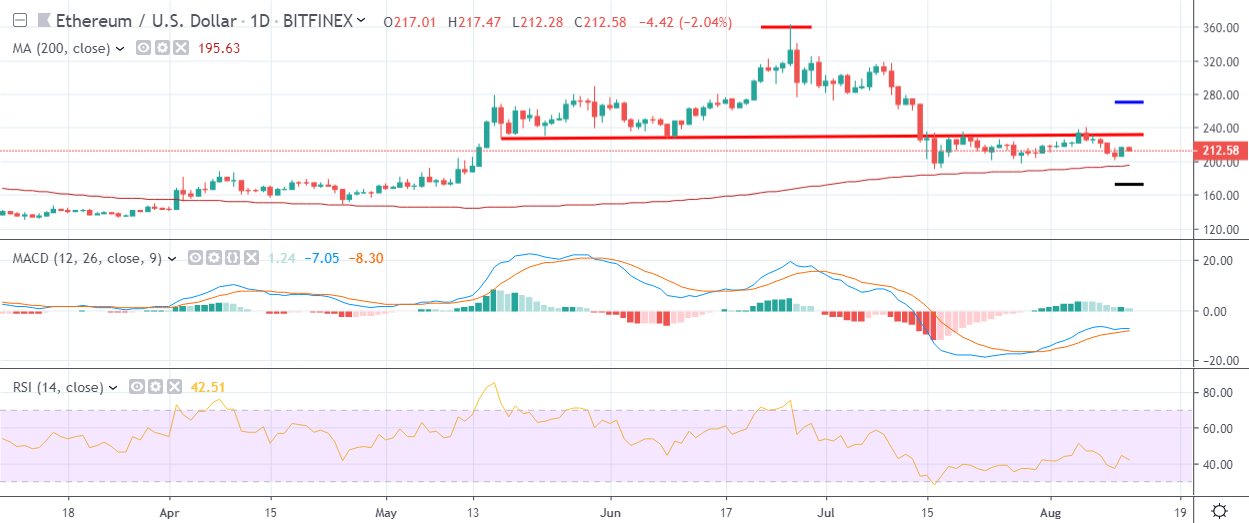
- The daily time frame shows that the ETH / USD pair is trading below the neckline of a head and shoulders pattern
Ethereum / USD Short-term price analysis
Ethereum has a bearish short-term trading bias, with the cryptocurrency still trading below its 200-period moving average on the four-hour time frame.
The four-hour time frame shows that the ETH / USD pair has moved back inside a neutral triangle pattern, following a false upside breakout towards the $240.00 level.
Technical indicators on the four-hour time frame currently have a slight bullish bias.
Pattern Watch
Traders should note that a bearish breakout from the triangle pattern could prompt a decline towards the $170.00 level.
Relative Strength Index
The RSI indicator on the four-hour time frame has a bullish bias and is currently attempting to stabilize above neutral territory.
MACD Indicator
The MACD indicator on the four-hour time frame is rising and is starting to issue a buy signal.
Ethereum / USD Medium-term price analysis
Ethereum has a neutral medium-term trading bias, with the ETH / USD pair consolidating around its trend defining 200-day moving average.
The daily time frame is showing that the ETH / USD pair is trading below the neckline of a bearish head and shoulders pattern, following a failed attempt to break higher.
Key technical resistance on the daily time frame is located at the $240.00 $275.00 levels, while key downside support is found at the $200.00 and $170.00 levels.
Technical indicators on the daily time frame currently have a slight bearish bias.
Pattern Watch
Traders should be on guard for a strong upside rally towards the $275.00 level to complete the bearish head and shoulders pattern.
Relative Strength Index
The RSI indicator on the daily time frame is bearish and continues to issue a sell signal.
MACD Indicator
The MACD indicator on the daily time frame is turning lower and currently has a slight negative bias.
Conclusion
Ethereum is coming under increasing downside pressure and risks falling below the $200.00 level, following the recent rejection its 200-period moving average on the four-hour time frame.
Overall, bulls quickly need to rally the ETH / USD pair away from the $200.00 level in order to avoid triggering a bearish head and shoulders pattern.
Check out our introductory guide to Ethereum.