 Earn with Nexo

Ethereum Price Analysis ETH / USD: Glimmer Of Hope
ETH could soon recover back to its $200 resistance level.
- Ethereum tumbles to its weakest trading level since April 2019
- The lower time frame shows that a potential bullish reversal pattern may be forming
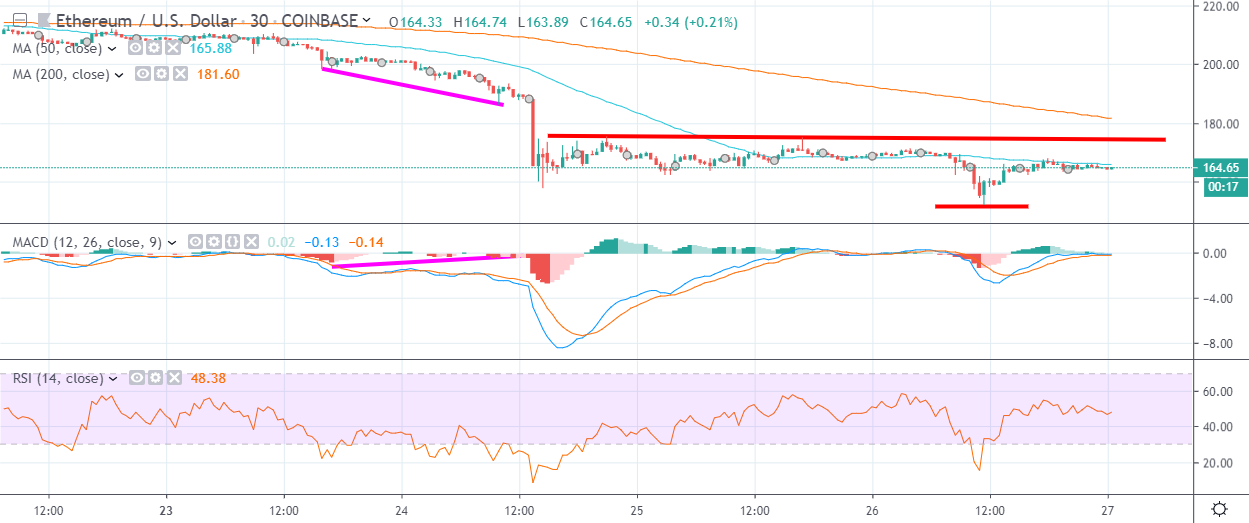
- The recent drop has created bullish MACD divergence on the 30-minute time frame extending towards the $210.00 level
Ethereum has staged a minor recovery towards the $165.00 level after falling alongside the broader cryptocurrency market, as Bitcoin tumbled below the $8,000 support level on Thursday. The second largest cryptocurrency has so far found strong technical support from just above the $150.00 level.
Technical analysis shows that the early week decline in the ETH / USD pair created substantial amounts of bullish MACD price divergence on the 30-minute time frame. The divergence currently extends towards the $200.00 resistance area and could signal an upcoming bullish rally in the ETH / USD pair.
When applying MACD price divergence, the lower the time frame where MACD divergence is present, the faster the divergence is usually reversed. MACD price divergence on the higher time frames usually takes much longer to reverse.
A potential bullish reversal pattern is also forming on the lower time frames, which holds a potential upside target of around $25.00, which would take the ETH / USD pair back towards the $200.00 price region.
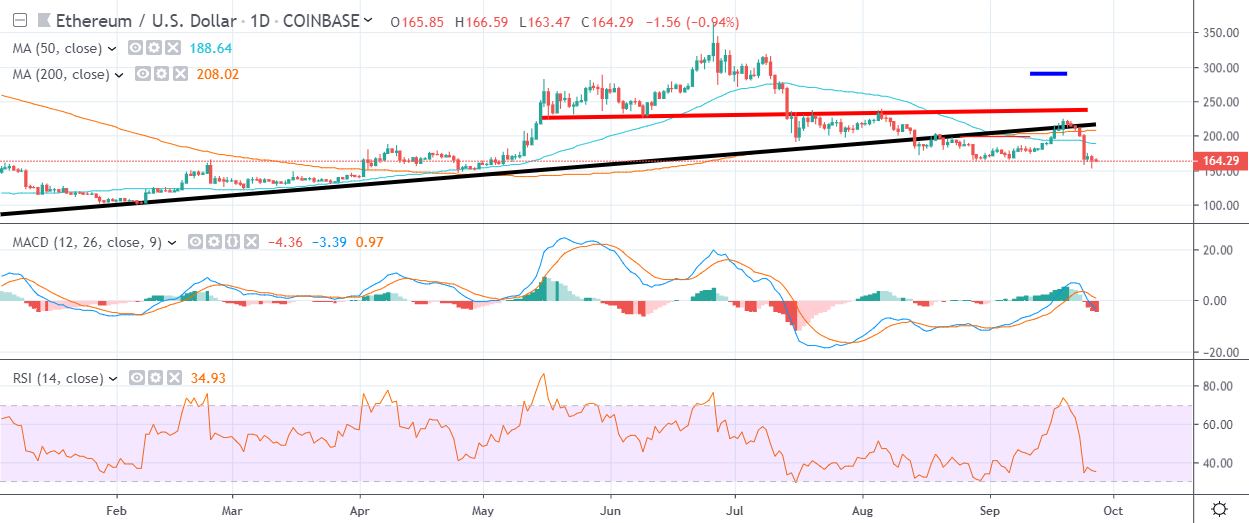
The RSI indicator on the daily time frame is not yet oversold, which may indicate that the ETH / USD pair may not yet be ready to turn higher. However, the RSI indicators on shorter time frames are indeed oversold, which certainly points to a possible short-term correction.
According to the latest sentiment data from TheTIE.io, the short-term sentiment towards Ethereum is bearish, at 42.00 %, while the overall long-term sentiment towards the cryptocurrency is neutral, at 47.00%.
Upside Potential
The four-hour time frame highlights the 200-period period moving average as key upcoming resistance, around the $185.00 level. A break above the $175.00 level would encourage technical buying, as it represents the neckline of an inverted head and shoulders pattern with $25.00 upside projection.
The daily time frame highlights the $207.00 level as key. The 200-day moving average is located around the $207.00 level, alongside the ETH / USD pair’s current weekly pivot point.
Downside Potential
The $150.00 level is currently the key support level that sellers need to break in order to encourage selling towards the $146.00 level.
The daily time frame is currently showing that once below the $146.00 level then the April 2nd trading low, around the $139.00 level, offers the strongest form of technical support.
Summary
Ethereum bulls need to move price above the $175.00 level to encourage a stronger recovery in the cryptocurrency back towards the $200.00 level.
Bullish MACD price divergence on the 30-minute time frame also suggests that the ETH / USD pair could soon recover back towards the $200.00 resistance area.
Check out our introductory guide to Ethereum.