
Ethereum Price Analysis ETH / USD: Lit Fuse
ETH's failure to sustain a rally has poor consequences.
- Ethereum is struggling to stage a rally above the $180.00 resistance level
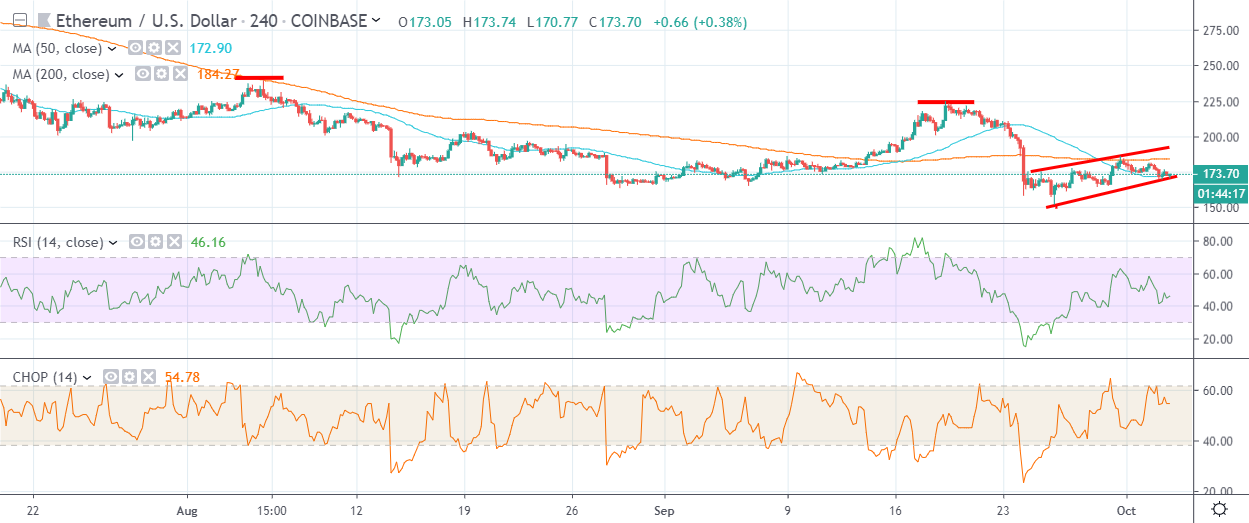
- The four-hour time frame shows that the ETH / USD pair is trapped within a bearish flag pattern
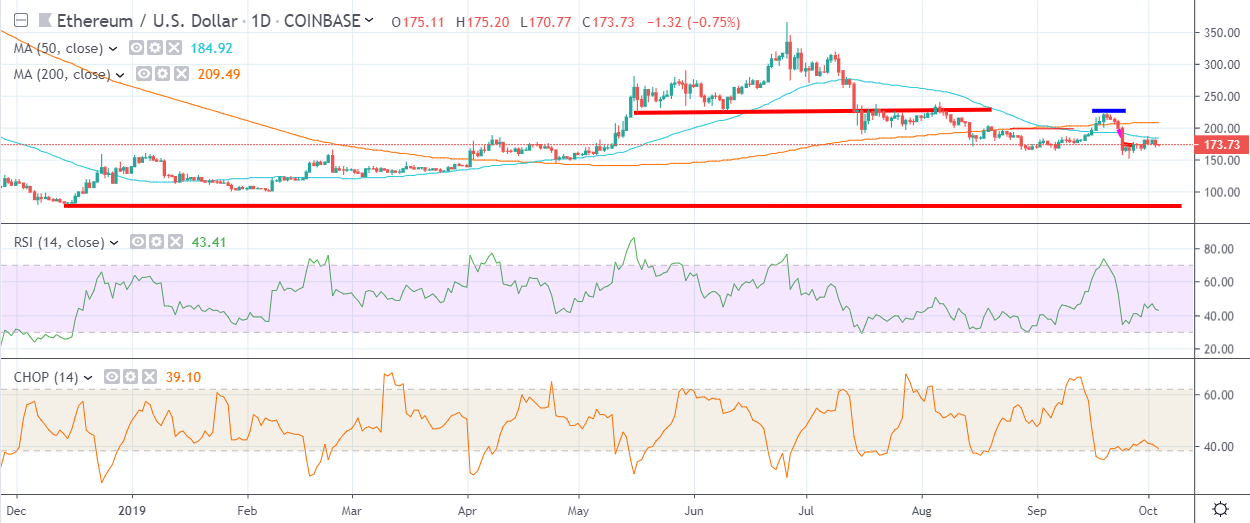
- The daily time frame shows that a much larger head and shoulders pattern could form if the ETH / USD pair continues to decline
Ethereum is back under downside pressure after the second-largest cryptocurrency failed to find meaningful buying interest above the $180.00 level as the early week rally fizzled-out.
The cryptocurrency is currently trading back towards its monthly price open, leaving the ETH / USD pair at risk of declining back towards the $150.00 level.
A break below the $150.00 level would be disastrous for Ethereum and could prompt a much-deeper decline towards at least the $136.00 support level and possibly an extended drop towards the December 2018 trading low.
Short-term technical analysis highlights a flag pattern, with the $170.00 level the trigger area for a potential bearish breakdown in the ETH / USD pair. The path of least resistance is currently to the downside, given the cryptocurrency’s short-term bearish status and weak trading sentiment.
The daily time frame shows that a much larger bearish head and shoulders pattern could be forming, with the $83.00 level a possible bearish target if the ETH / USD pair declines below the $136.00 level.
Worryingly for bulls, traders are currently using any technical corrections to sell the ETH / USD pair, as highlighted by the RSI indicator on the daily time frame. Unless a break above the $188.00 level is forthcoming, the cryptocurrency is likely to test back towards the worst levels of last month.
The Choppiness Index, which highlights whether an asset is trending or range bound, shows that the ETH / USD pair is still trending lower on a medium-term basis.
Going forward, Ethereum is likely to experience heightened technical selling once below the $150.00 level, while a rally above the $188.00 level should see the cryptocurrency testing towards the $200.00 level.
According to the latest sentiment data from TheTIE.io, the short-term sentiment towards Ethereum is neutral, at 45.00 %, while the overall long-term sentiment towards the cryptocurrency continues to weaken, at 45.50%.
Upside Potential
The four-hour time frame highlights that the ETH / USD pair has to rally above the $185.00 level to turn bullish over the short-term. The top of the bull flag pattern on the four-hour time frame is currently located at the $193.00 level.
The ETH / USD pair’s 200-day moving average is currently the strongest form of technical resistance, at the $205.00 level and remains a key level bulls need to reclaim this month.
Downside Potential
The $170.00 level is currently the key technical support level in the short-term, with the $164.00 level the only notable technical support before the $150.00 level.
Below the $150.00 level, the $136.00 and $100.00 level offer important technical support, before the December 2018 trading low, which is located around the $82.00 level.
Summary
Ethereum is back under downside pressure after failing to sustain the early-month rally above the $180.00 level.
Technical analysis suggests that a sustained drop below the $150.00 support level could be disastrous for the ETH / USD pair over the medium-term.
Check out our introductory guide to Ethereum.