
Ethereum Price Analysis ETH / USD: Watershed Moment
ETH will be testing its resistance and support levels this week.
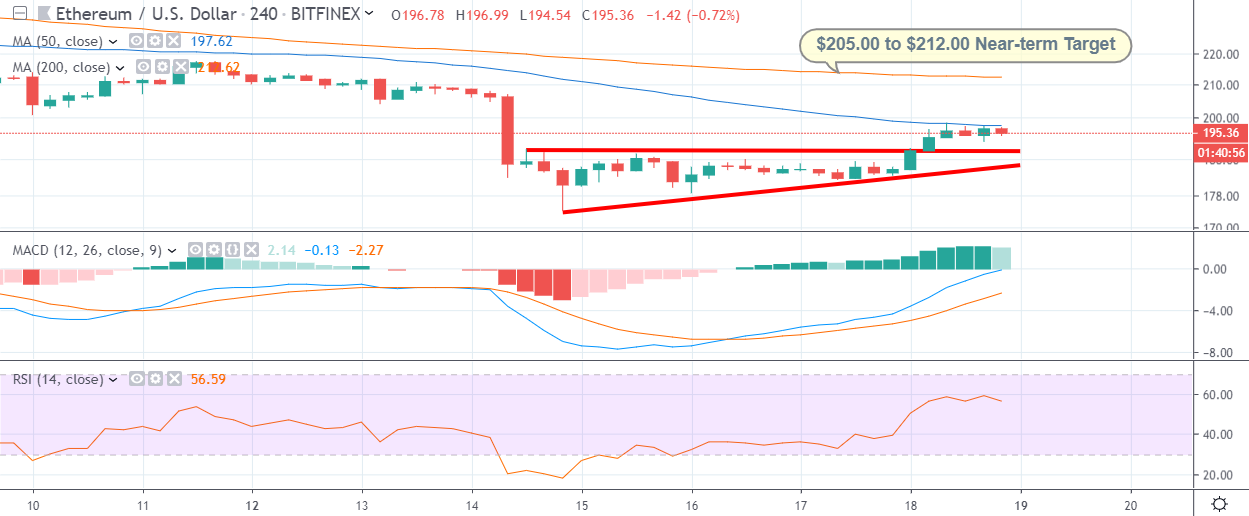
- Ethereum is attempting to recover short-term bullish momentum with the $200.00 level the strongest form of near-term resistance
- Technical analysis shows that the $212.00 level is the main upcoming resistance area to watch intraday, while the $160.00 level is still a potential bearish target
Ethereum has started the new trading week with a more positive tone as the broader cryptocurrency market attempts to recover some of last week’s steep losses. The main point of contention this week for ETH / USD traders is whether a medium to long-term price floor was established last week, or indeed whether bears will breach the $174.00 level and push price much lower.
After such a protracted move lower in the ETH / USD pair it was always highly likely that a short-term upside technical correction was going to occur at some point. Moving into today’s U.S. session we are seeing the second largest cryptocurrency recovering above its 50-period moving average on the four-hour time frame, around the $196.00 level.
Technical confirmation that a meaningful trading low is in place may also be needed this week, hence we may see the cryptocurrency testing somewhat lower, before the ETH / USD pair starts to trade significantly higher. In this instance, a bullish double-bottom pattern formation around the $180.00 to $190.00 level would likely be the trigger for a much stronger up move back towards at least the $230.00 level.
According to the latest sentiment data from TheTIE.io the short-term sentiment towards Ethereum is slightly bullish, at 51.10%, while the overall long-term sentiment towards the cryptocurrency is slightly negative, at 46.21%.
Upside Potential
The four-hour time frame is showing that the short-term upside potential for the ETH / USD pair is fairly straight-forward, with a move above the $200.00 level likely to prompt a technical test of key trendline resistance, around the $212.00 level.
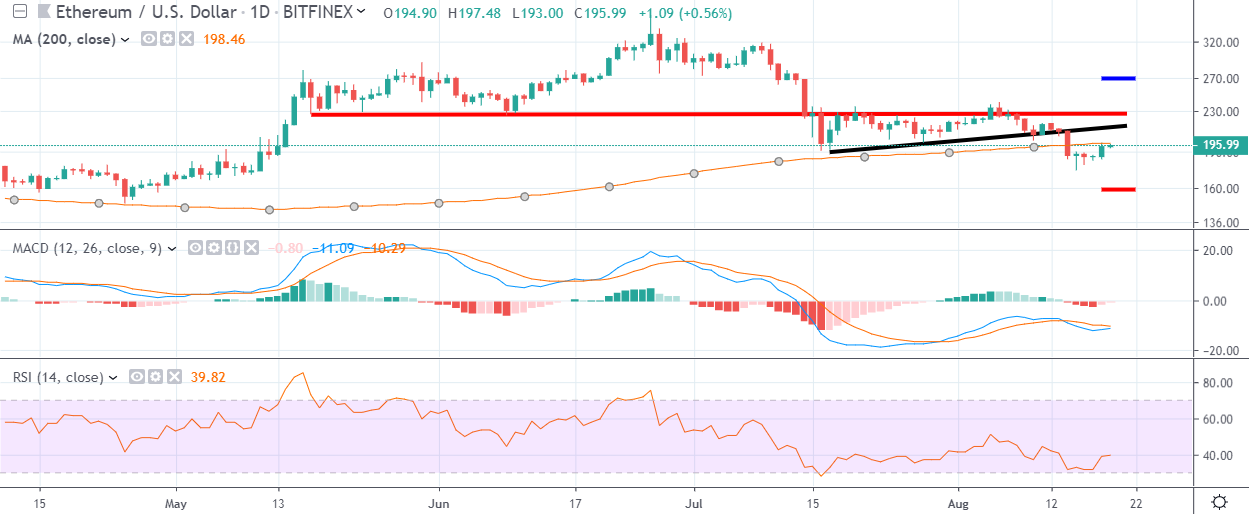
The daily time frame also highlights the $212.00 level as a key resistance area to watch, with the $225.00 level the next major resistance level above. The mentioned time frame also highlights the $260.00 resistance level as a potential upside target if we see a much stronger recovery in the ETH / USD pair this week.
Downside Potential
The downside potential for the ETH / USD pair is going to be fairly limited unless the $174.00 support level is actually broken. The $190.00 and $184.00 levels currently dominate as the near-term support areas to watch below the $196.00 level.
The daily time frame is currently showing that the ETH / USD pair’s 200-day moving average is critical technical support this week, at $190.00, while a drop below the $174.00 level is likely to trigger a much stronger technical sell-off towards at least the $160.00 level.
Summary
Traders should be on guard for a potential bullish reversal in the ETH / USD pair this week if the $212.00 level is broken, with the $225.00 to $260.00 levels the major near-term upside targets.
A sustained drop below the $174.00 support level would be disastrous for the ETH / USD pair, and we should then expect to see a strong down move towards at least the $160.00 level.
Check out our introductory guide to Ethereum.