
Ethereum / USD Technical Analysis: Under Pressure
ETH / USD Technical Analysis - The price is taking a beating, but it still hasn't fallen beneath an ascending pattern.
[vc_row][vc_column][vc_column_text]
- Ethereum is neutral in the short-term, with the cryptocurrency testing towards its 200-period moving average on the four-hour time frame
- An ascending triangle pattern is clearly visible on the four-hour time frame
- Ethereum remains bearish over the medium-term, with bulls recently failing to rally the cryptocurrency above its 200-day moving average
Ethereum / USD Short-term price analysis
In the short-term, the ETH / USD pair has a neutral trading bias with the cryptocurrency now testing towards its 200-period moving average on the four-hour time frame, following a strong downside move below its 100-period on the mentioned time frame.
Ethereum has been under selling pressure since its swift reversal from the $170.00 level on February 24th.
An ascending triangle pattern is clearly visible on the four-hour time frame, with the pattern currently holding an upside or downside projection of around $40.00. Traders should note that there are times when ascending triangle patterns form as reversal patterns at the end of protracted downtrends, but they are typically continuation patterns of the prevailing market trend.
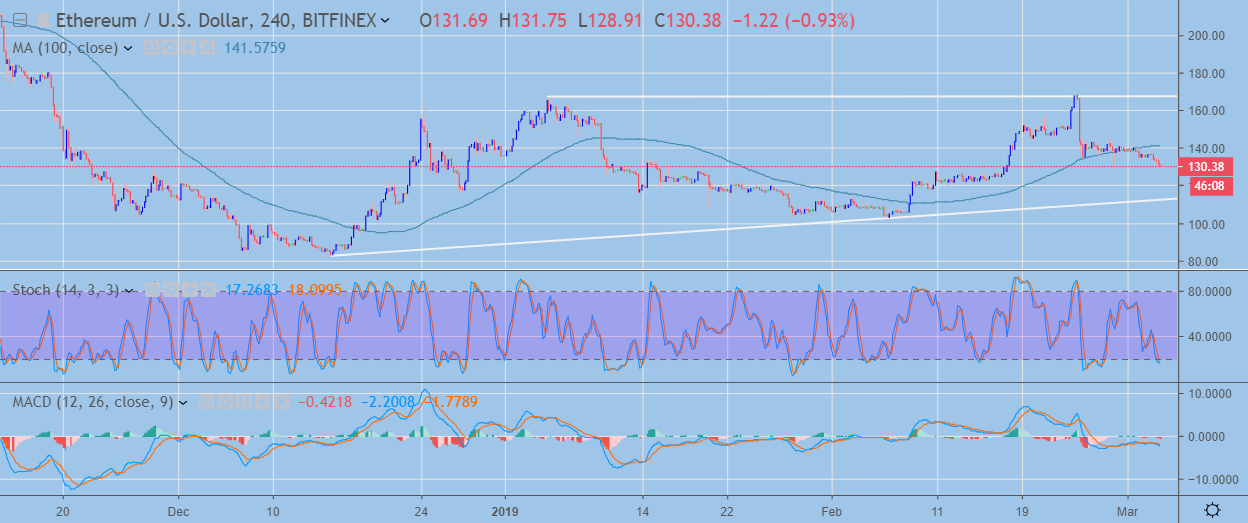 ETH / USD H4 Chart (Source: TradingView)
Pattern Watch
The lower trendline of the ascending triangle pattern is currently found at the $114.00 level, traders should continue to monitor trendline support if selling pressures accelerate.
MACD Indicator
The MACD indicator on the four-hour time frame has turned bearish and is currently generating a sell signal.
Stochastic Indicator
The Stochastic indicator on the four-hour time frame is bearish and moving towards oversold territory, which could eventually signal a reversal higher in the ETH / USD pair.
Ethereum / USD Medium-term price analysis
Ethereum has a bearish medium-term outlook, with the ETH / USD pair failing to break above its key 200-day moving average during last month rally.
A symmetrical triangle pattern is visible on the daily time frame, with the neutral pattern starting to narrow, which usually indicates that a decisive breakout from the pattern may be nearing.
It is worth noting that key technical support below the triangle pattern is found at the ETH / USD pair’s former monthly trading low, around the $102.00 level.
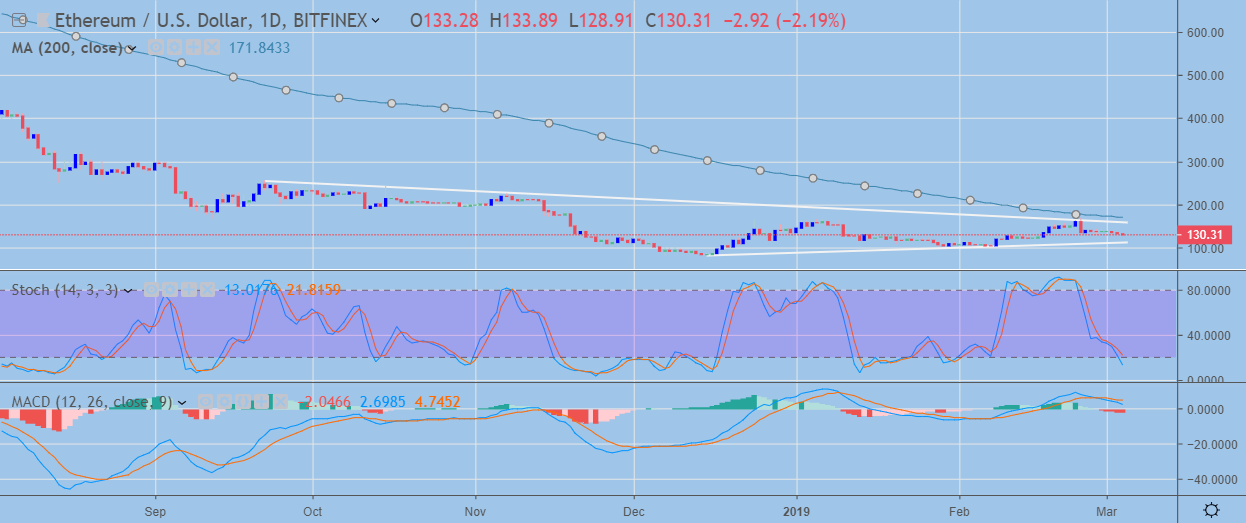 ETH / USD Daily Chart (Source: TradingView)
Pattern Watch
Traders should carefully monitor the symmetrical triangle pattern, particularly daily price closes above or below the triangle.
MACD Indicator
The MACD indicator on the daily time frame has turned bearish and shows scope for further downside in the ETH / USD pair.
Stochastic Indicator
The Stochastic Indicator on the time frame is bearish, although similar to the four-hour time frame, the indicator is moving towards oversold conditions.
Conclusion
The ETH / USD pair is at risk of turning bearish in the short-term if selling activity gathers pace below its key 200-period moving average on the four-hour time frame. The key downside test for the cryptocurrency will be at trendline support, at the $114.00 level.
If bulls can fend off the recent bearish attack, we should expect a rebound over the medium-term towards the $160.00. A sustained break above the $172.00 resistance level could spark a stronger rally above the $200.00.
Decentral Media, Inc., the publisher of Crypto Briefing, is not an investment advisor and does not offer or provide investment advice or other financial advice. Nothing on this website constitutes, or should be relied on as, investment advice or financial advice of any kind. Specifically, none of the information on this website constitutes, or should be relied on as, a suggestion, offer, or other solicitation to engage in, or refrain from engaging in, any purchase, sale, or any other any investment-related activity with respect to any transaction. You should never make an investment decision on an investment based solely on the information on our website, and you should never interpret or otherwise rely on any of the information on this website as investment advice. We strongly recommend that you consult a licensed investment advisor or other qualified financial professional if you are seeking investment advice on an investment.
[/vc_column_text][/vc_column][/vc_row]