
Bitcoin Investor Psychology, Not Just Fear and Greed
What can we learn from Bitcoin's price history?
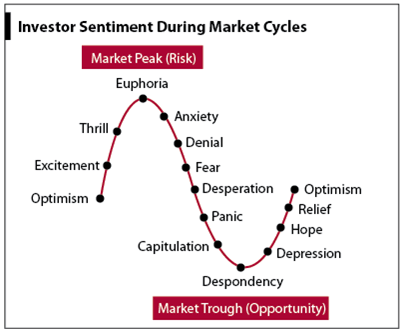
During its three major price cycles, Bitcoin investor behavior has demonstrated a more nuanced range of emotions than just fear and greed.
Coin Metrics examined Bitcoin investor behavior during the three major BTC cycles around peaks, lows, and mid-cycle corrections. Their findings suggest that fear and greed are not the sole drivers of investor decisions, with optimism, relief, and denial all playing a part.
The Three Cycles of Bitcoin Price History
Coin Metrics broke Bitcoin’s price history down into three cycles: the 2013 bubble; the 2014-2018 bubble; and the current cycle.
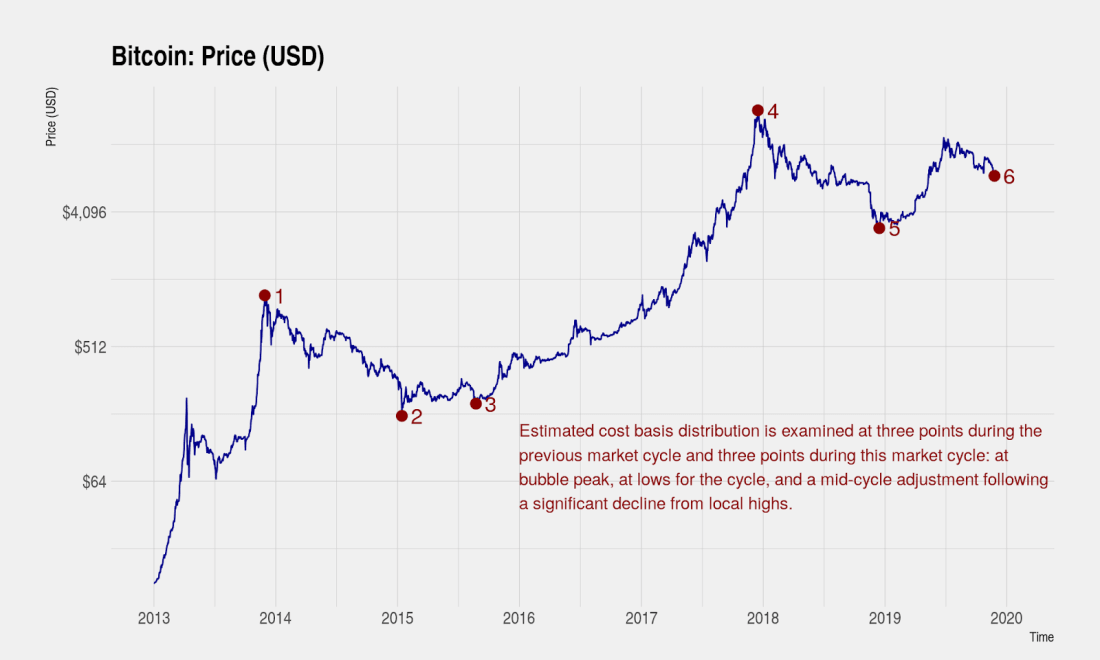
The analysts note the peaks, the lows, and the mid-cycle corrections during those cycles, and measured Bitcoin trading activity around those events.
The established wisdom has been that markets are driven by fear and greed. Investors sell at lows out of fear and buy at highs out of greed. Smart investors do the opposite, understanding that by playing against those emotions they can outperform the market. But does that narrative hold true for Bitcoin?
Fear and Greed Not Always Significant
Activity approaching the peak of the 2013 cycle showed that Bitcoin holders continued holding as the peak approached. During the two-month price rise from around $100 to over $1,100, long-term holders continued holding and new entrants began buying. Those who held Bitcoin at its $100 range in this cycle were early adopters.
As Bitcoin approached $700, there remained little sell pressure, despite the enormous gains already made by earlier holders. It took until BTC hit around $800 before there was any significant movement in Bitcoin transactions. That suggests that in the 2013 approach to then-all-time high prices, early holders of Bitcoin began liquidating their positions, driving an end to the positive momentum.
The 2014-2018 Cycle
The bubble from 2014 to 2018, peaking in December 2018, hit a low in early 2015 and then a mid-cycle correction later in the same year. After the November 2013 peak, Bitcoin plunged 84 percent within a year. Yet, as Coin Metrics’ analysis shows, even at those lows of $176 for the cycle, “43% of Bitcoin held had unrealized gains and 57% had unrealized losses.”
That indicates that 4 out of 10 investors were still in profit at $176. The other 6 had bought into the previous bubble. However, the number of early adopters plummeted. At the 2013 peak, over half of the Bitcoin in existence was in the hands of those who bought it for under $100. 6.5 million Bitcoin were purchased at prices between $0 and $100. 4 million of those were bought for less than $50.
Between the 2013 peak and the 2015 low, 1.5 of the 4 million early buyers of Bitcoin had sold their holdings, suggesting fear rather than greed had taken hold during the rapid 2013 price rise.
By the August 2015 mid-cycle correction, both peak buyers and early adopters had sold their holdings. As Coin Metrics pointed out, “investor psychology suggests that prices cannot truly bottom until all investors have reached the point of maximum pain and capitulation is complete.”
That capitulation among early buyers and 2013 FOMO buyers appears to have been reached around the time of the 2015 correction, and partly a cause of it.
The Current Cycle
The current cycle mirrors many of the behaviors observed above. There was little selling among buyers who had purchased BTC for $1,000 until the price hit $16,000, suggesting long-term holders were prepared, as in 2013, to wait for substantial gains before selling.
The post-all-time high drop is remarkably similar to that of the previous cycle. Bitcoin fell around 84 percent over a year. 39 percent of holders at the lows were still in profit — similar to the 43 percent of early buyers holding on in 2015.
The inference that can be drawn is that “following a bubble, maximum pain and capitulation can only be reached when prices decline to a point where only roughly 40% of Bitcoin held have unrealized gains.”
As BTC declined toward $3,000, heavy selling pressure was observed among buyers at peak prices and early buyers, which is again similar to the previous cycle, and indicative of the role that human emotion plays in bubbles and busts.
One key difference in this cycle is that at current prices, representing a mid-cycle adjustment, the selling pressure has come not only from early buyers and FOMO buyers. The current selling activity is broad-based, from holders of Bitcoin who purchased the digital asset at all price points.
What that could indicate is that the current cycle has a longer period to play out before a full correction can be confirmed. The mid-cycle correction of around $7,000 may not be the full correction at all, and further price falls may occur.
Though it does remain a new asset class, with a growing history of price movement evaluating Bitcoin’s performance is becoming a more meaningful exercise.