 Earn with Nexo

Holo Price Analysis HOT / USD: Breaking Out
Holo is finally breaking above its price channel, with traders igniting a bullish pattern and pointing to further gains.
- Holochain has a strong bullish short-term outlook, with the cryptocurrency moving to a new all-time high
- The HOT / USD pair has an increasingly bullish medium-term trading bias
- The daily time frame is showing that a major technical breakout has now occurred
Holo / USD Short-term price analysis
Holo has a strong bullish short-term outlook, with the HOT / USD pair advancing to a new all-time trading high.
The four-hour time frame is showing that a major technical breakout has occurred, with an inverted head and shoulders pattern being triggered into action.
Technical indicators on the four-hour time frame are bullish and continue to generate strong buy signals.
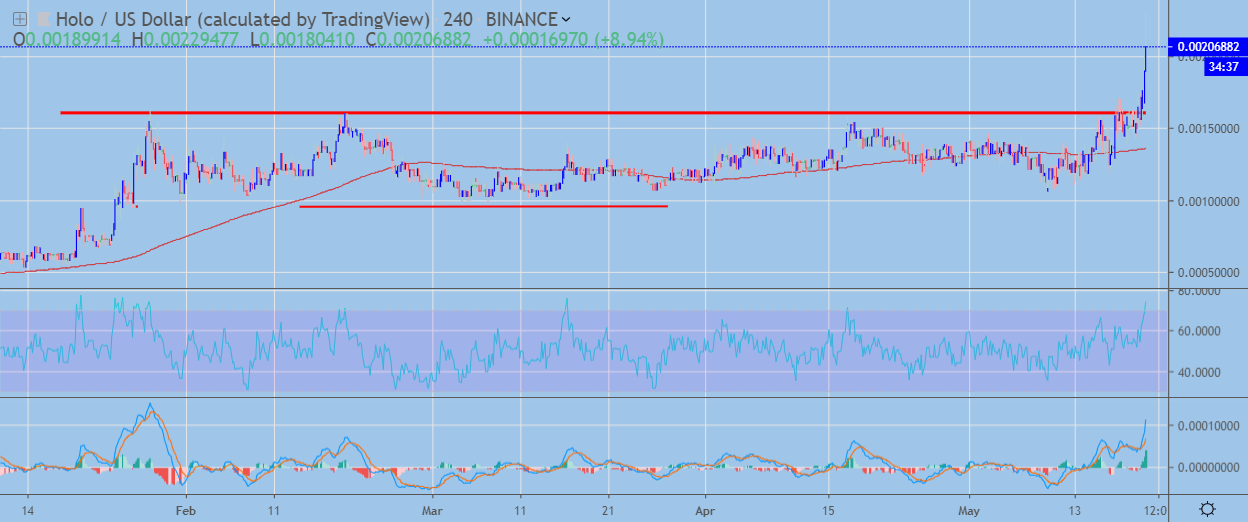 HOT / USD H4 Chart by TradingView
Pattern Watch
Traders should note that the HOT / USD pair can still trade much higher before the bullish pattern on the daily time frame reaches its upside objective.
Relative Strength Index
The RSI indicator is bullish the daily time frame, although it is now trading in overbought territory.
MACD Indicator
The MACD indicator on the daily time frame is bullish and is currently generating a strong buy signal.
Holo / USD Medium-term price analysis
Holo has an increasingly bullish medium-term trading outlook, with the HOT / USD pair performing a major technical breakout on the daily time frame.
Holo bulls have finally triggered the large inverted head and shoulders pattern that has been present across the daily time frame since January 2019.
Technical indicators on the daily time frame are bullish and continue to highlight growing medium-term upside pressure.
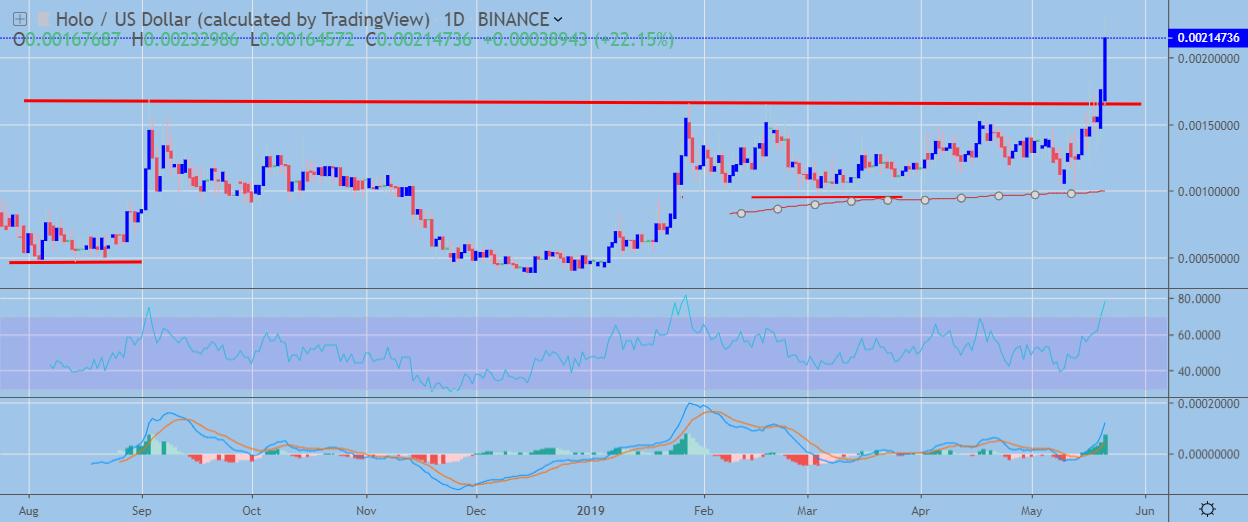 HOT / USD Daily Chart by TradingView
Pattern Watch
Traders should note that the HOT / USD pair can still trade much higher before the bullish pattern on the daily time frame reaches its upside objective.
Relative Strength Index
The RSI indicator is bullish the daily time frame, although it is now trading in overbought territory.
MACD Indicator
The MACD indicator on the daily time frame is bullish and is currently generating a strong buy signal.
Conclusion
Holo has performed a major bullish technical breakout across both time frames, with the HOT / USD pair advancing to a new all-time price high.
The inverted head and shoulders pattern on the four-hour time frame is approaching its upside target, while the larger bullish pattern on the daily time frame still has substantial upside ground to cover before it reaches its upside objective.
We covered Holochain and the HOT token in our introductory coin guide.
If you’re interested in what are the fundamentals that are making it trend upwards, check out our DARE for the project.