 Earn with Nexo
Holochain Price Analysis HOT / USD: Unrealized Potential
HOT needs some push to unleash its huge upside potential.
- Holochain has a bullish short-term bias and a bearish medium-term trading outlook
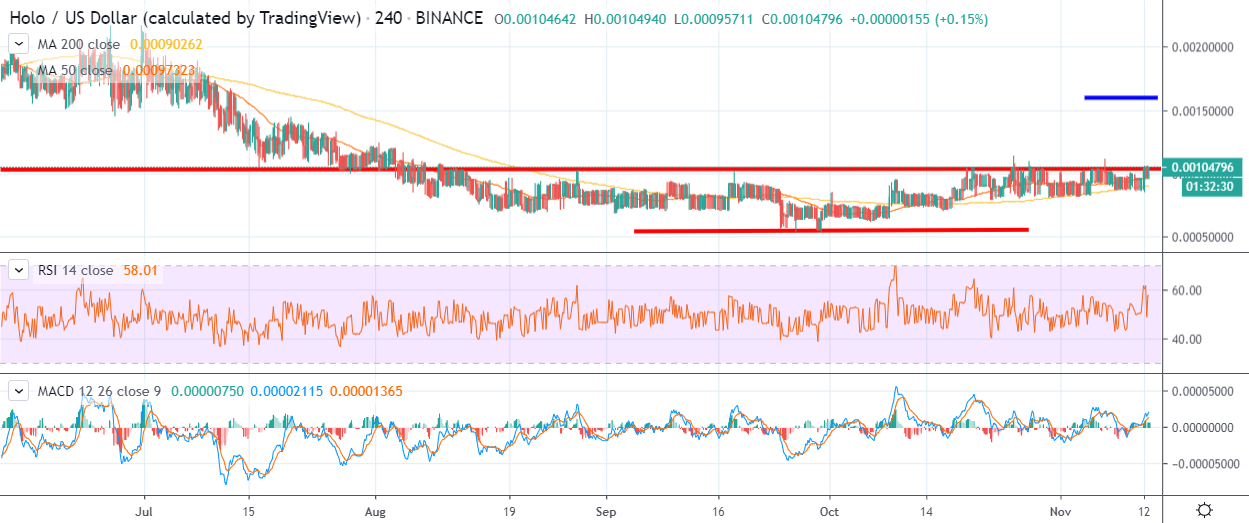
- The four-hour time frame shows that a bullish inverted head and shoulders pattern has formed
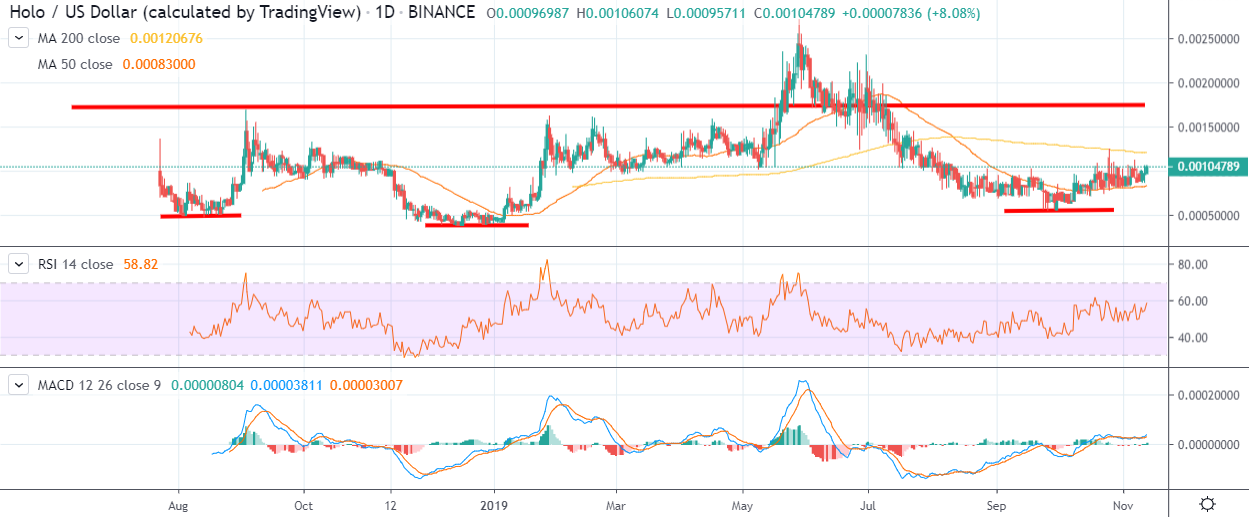
- The daily time frame is showing an even larger inverted head and shoulders pattern in play
Holochain has been slowly advancing over the last few weeks, with the cryptocurrency racking up an impressive twenty percent gain since the start of November.
Even more impressive is the HOT / USD pair’s trading performance since the end of September, with the cryptocurrency adding just over fifty percent to its trading value.
Since the start of the year, Holochain has added over one-hundred and twenty percent, although it currently trades down by over sixty percent from its 2019 trading peak.
Holochain is well positioned to build on its recent trading gains, according to the short-term technical analysis. The cryptocurrency is currently probing against the neckline of a bullish inverted head and shoulders pattern with an upside projection that could add a further fifty percent to its value.
The daily time frame shows that a rally of around fifteen percent is needed before the HOT / USD reclaims its technically bullish status. The mentioned time frame also shows a huge inverted head and shoulders pattern.
A rally towards the $0.001650 level is currently needed for the HOT / USD pair to trigger the large bullish pattern on the daily time frame. Holochain could test beyond the best levels of 2019, if the pattern plays out to its full potential.
According to the latest sentiment data from TheTIE.io, the short-term sentiment towards Holochain is bullish, at 68.00 %, while the overall long-term sentiment towards the cryptocurrency is very strong, at 79.00%.
Upside Potential
The four-hour time frame shows that a large inverted head and shoulders pattern has formed, with the pattern holding an upside projection of around fifty percent.
Key technical resistance for the HOT / USD pair above the $0.001050 level is currently located at the $0.001200 and $0.001650 levels.
Downside Potential
The four-hour time frame is showing that the HOT / USD pair has strong short-term technical support around the $0.000850 level.
The daily time frame shows that a move below the $0.000800 level would be extremely bearish for the cryptocurrency and could sink the cryptocurrency back towards the September trading low.
Summary
Holochain has been making a steady move higher recently and is now in a very strong technical position in the short-term.
Continued gains above the $0.001050 level is currently needed to trigger a large inverted head and shoulders pattern with tremendous upside potential.
For a quick overview of Holo and the HOT token, check out our coin guide.
A detailed analysis of the project is available in our DARE.