ICON Price Analysis ICX / USD: Staking Out A Price Channel
Recent news about staking wasn't nearly enough to change the outlook.
Share this article
- ICON has a bullish short-term bias, with the cryptocurrency moving back above its 200-period moving average on the four-hour time frame
- The four-hour time frame still shows the presence of a bearish head and shoulders pattern
- The medium-term time frame is neutral, with the ICX / USD pair trapped within a sideways price channel
Fundamental Analysis
ICON is gaining bullish momentum in anticipation of the launch of staking on its network. In August, ICX holders will receive incentives through ICX Staking and Voting reward. This would result in about a 15.81% maximum annual reward and could attract more HODLers to its network.
ICON / USD Short-term price analysis
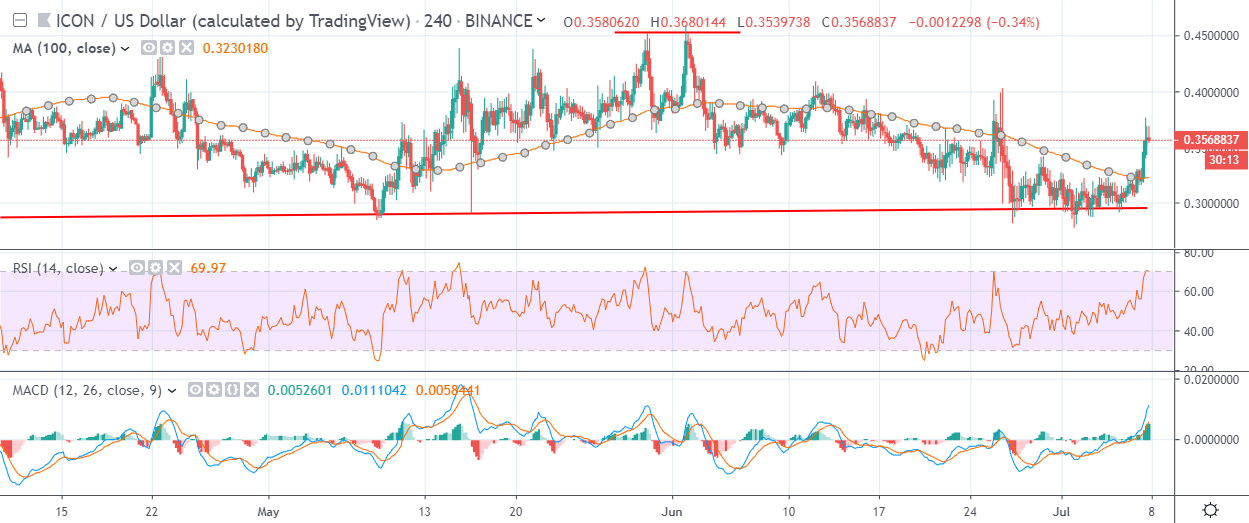
ICON has a bullish short-term bias, with the ICX / USD pair recovering back above its 200-period moving average on the four-hour time frame.
The four-hour time frame shows that a large head and shoulders pattern still remain present, with ICX / USD bulls still unable to invalidate the bearish pattern.
Technical indicators on the four-hour time frame have turned bullish and continue to generate a buy signal.
Pattern Watch
Trading should note that the downside projection of the bearish pattern would take the ICX / USD pair back towards the February 2019 trading low.
Relative Strength Index
The RSI indicator has also turned bullish on the four-hour time frame, although it is approaching overbought territory.
MACD Indicator
The MACD indicator on the four-hour time frame is bullish and continues to generate a buy signal.
ICON / USD Medium-term price analysis
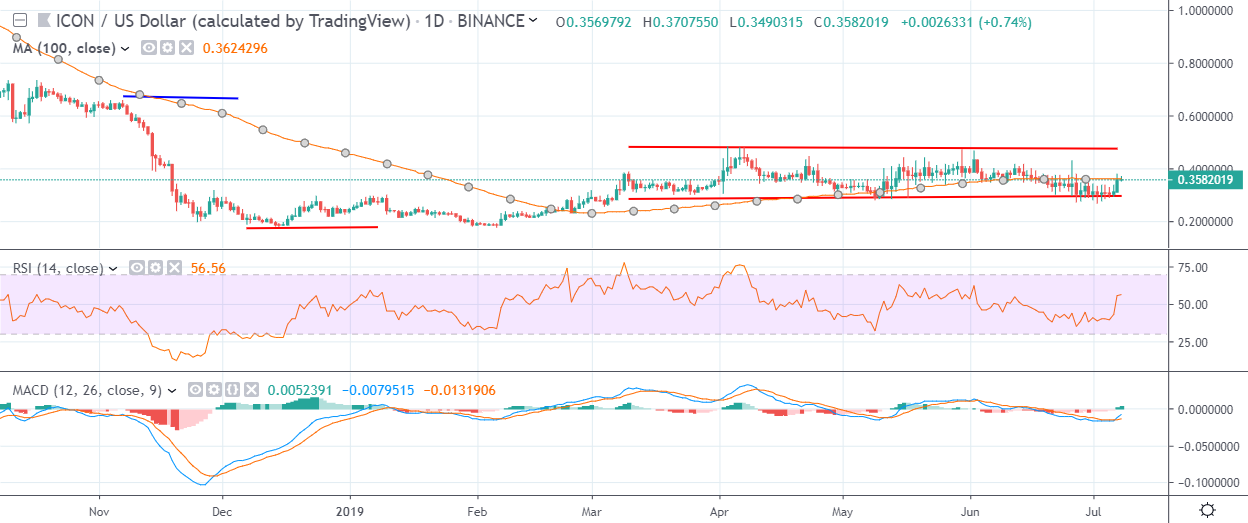
ICON has a neutral medium-term trading outlook, with the cryptocurrency trapped in a period of consolidation around its 200-day moving average.
The daily time frame is showing that the ICX/USD pair is trapped within a sideways price channel, highlighting the directionless nature of the cryptocurrency at present.
Technical indicators on the daily time frame are now starting to generate a buy signal.
Pattern Watch
Range trading is favored until a clear technical breakout has occurred from the sideways price channel.
Relative Strength Index
The RSI indicator on the daily time frame has moved above neutral and is now issuing a buy signal.
MACD Indicator
The MACD indicator is rising on the daily time frame, with the MACD histogram and signal line issuing buy signals.
Conclusion
The recent strong rally in ICON has failed to change the short and medium-term technical outlook for the cryptocurrency.
The sideways channel on the daily time frame highlights the overall uncertainty towards the ICX / USD pair, with the cryptocurrency still trading some thirty percent below the top of the price channel.
As always, if you need a brief introduction to ICON, we have it!
Share this article
