 Earn with Nexo

IOST / USD Price Analysis: Traders Taking Profit
A near-term correction still doesn't invalidate positive fundamental and technical indicators.
- IOST has a bearish short-term trading bias, with the cryptocurrency slipping below its 200-period moving average on the four-hour time frame
- The IOST / USD pair has bullish medium-term outlook, with price still trading above its 200-day moving average
- A bullish inverted head and shoulders pattern still remains valid on the daily time frame
IOST / USD Short-term price analysis
IOST has a bearish short-term trading outlook, with the IOST / USD pair slipping below its key 200-period moving average on the four-hour time frame.
The four-hour time frame is currently showing a head and shoulders pattern in play, with the IOST / USD pair trading below the neckline of the bearish pattern.
The latest move lower in the IOST / USD pair has reversed any bearish MACD price divergence on the four-hour time frame.
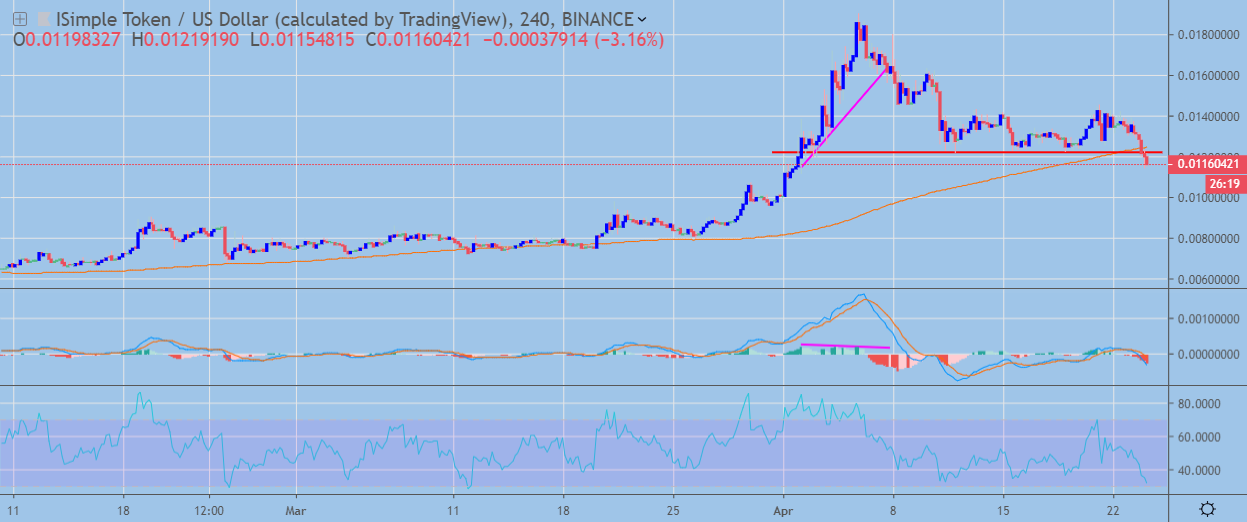 IOST / USD H4 Chart by TradingView
Pattern Watch
Traders should note that the IOST / USD pair will target the March 2019 swing-low if the head and shoulders pattern reaches its full downside projection.
Relative Strength Index
The RSI indicator on the four-hour time frame is bearish, although it has now moved into oversold territory.
MACD Indicator
The MACD indicator on the four-hour time frame is bearish with the MACD signal issuing a strong sell signal.
Fundamental Analysis
IOST is selling off after the recent surge in price. Investors seem to be taking profit from the positive announcements made recently. Earlier this month the company received funding from BlockGroup, with $200M under management. The company has also announced that it surpassed Ethereum in daily transaction volume.
IOST / USD Medium-term price analysis
IOST has a bullish medium-term outlook, with the IOST / USD pair still trading above its 200-day moving average despite the recent move lower.
The daily time frame is showing a valid inverted head and shoulders pattern, with the IOST / USD pair moving lower after bulls recently failed to move the cryptocurrency above the neckline of the pattern.
Technical indicators on the daily time frame have turned bearish and show scope for further losses.
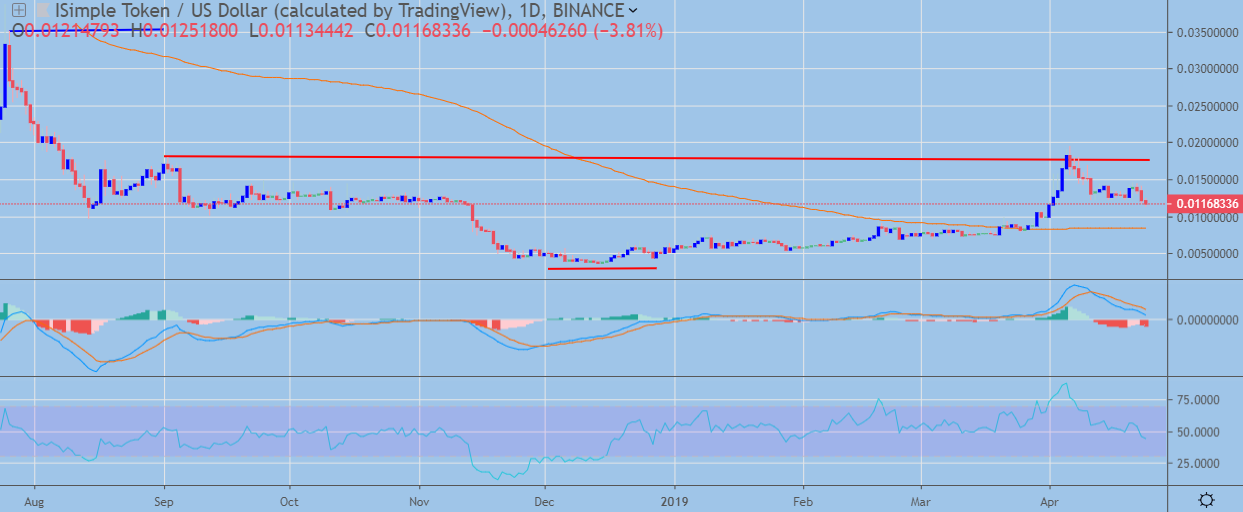 IOST / USD Daily Chart by TradingView
Pattern Watch
Traders should note that the bullish target of the inverted head and shoulders pattern is the July 2018 monthly high.
Relative Strength Index
The RSI indicator on the daily time frame has turned bearish and shows scope for further downside.
MACD Indicator
The MACD indicator on the daily time frame has turned bearish and is currently issuing a sell signal.
Fundamental Analysis
Although the price has been going down during the past few weeks, the project continues to take concrete steps to increase its transaction volume and user base. This should have a positive effect on the adoption and the demand for the IOST token in the medium-term. It is also important to mention that the project is backed by institutional investors, which should help it create valuable partnerships and further scale the network in the future.
Conclusion
IOST is under pressure in the near-term, with technical indicators across both time horizons pointing to further losses for the IOST / USD pair.
The medium-term picture for the cryptocurrency still remains fairly bright, with the daily time frame showing a large bullish pattern, as price continues to trade above its 200-day moving average.
Check out our coin guide for IOST.