
Komodo Price Analysis KMD / USD: Atomic Euphoria
The release of a mobile DEX generated a positive reaction.
- Komodo has a bullish short-term bias, with the cryptocurrency now trading above its 200-period moving average on the four-hour time frame
- The four-hour time frame shows that bulls are trying to invalidate a large head and shoulders pattern
- The daily time frame continues to show an extremely large bullish pattern
Fundamental Analysis
Komodo spiked after the company announced the public beta phase of the AtomicDEX platform on Android. This will allow users to make atomic swaps directly from their phones. According to the project, the app is the “industry’s only mobile-native decentralized exchange built on anything-to-anything, asset-agnostic atomic swaps” and it “represents a generational change in atomic swap technology”.
Komodo / USD Short-term price analysis
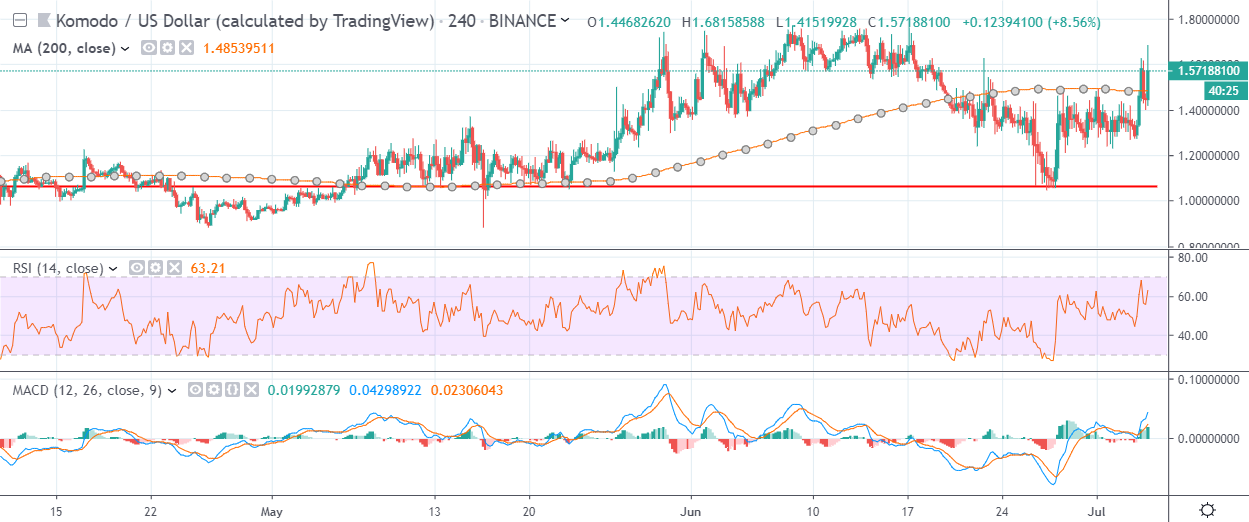
Komodo has a bullish short-term bias, with the cryptocurrency trading above its key 200-period moving average on the four-hour time frame.
The four-hour time frame is showing that KMD / USD bulls are attempting to invalidate a large head and shoulders pattern, following a strong reversal from neckline support.
Technical indicators are bullish on the four-hour time frame and continue to generate a buy signal.
Pattern Watch
Traders should expect heavy technical buying if the head and shoulders pattern on the four-hour time frame is invalidated.
Relative Strength Index
The RSI indicator has turned bullish on the four-hour time frame, highlighting the growing short-term upside momentum.
MACD Indicator
The MACD indicator is bullish on the four-hour time frame and continues to generate a buy signal.
Komodo / USD Medium-term price analysis
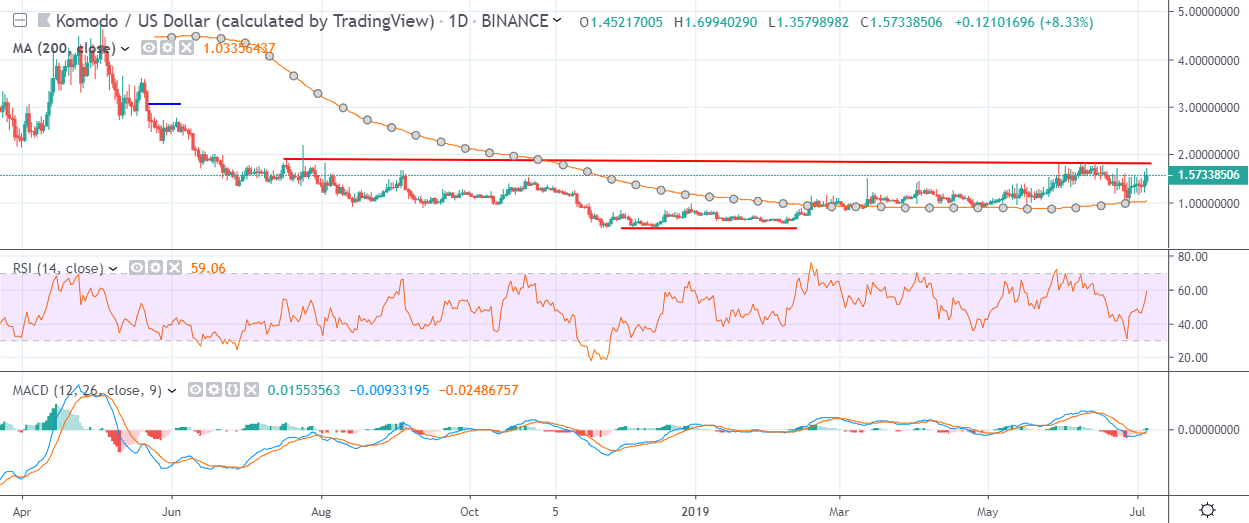
Komodo has a bullish medium-term outlook, with the cryptocurrency trading well above its trend defining 200-day moving average.
The daily time frame is showing an extremely large inverted head and shoulders pattern, with the cryptocurrency now testing back towards the neckline its neckline.
Technical indicators across the daily time frame have turned bullish and are now issuing a buy signal.
Pattern Watch
Traders should note that the May 22nd 2018 swing-high remains the overall upside objective of the inverted head and shoulders pattern on the daily time frame.
Relative Strength Index
The RSI indicator has turned bullish on the daily time frame and is now issuing a buy signal.
MACD Indicator
The MACD indicator on the daily time has turned bullish, with both the MACD signal line and histogram issuing buy signals.
Conclusion
Komodo has an improving technical outlook over the medium-term, with the inverted head and shoulders pattern on the daily time frame suggesting that a strong bullish breakout is nearing.
Short-term bulls now need to invalidate the bearish pattern on the four-hour time frame to further secure the KMD / USD pair’s near-term technical outlook.
Check out Komodo in our coin guide.