 Earn with Nexo

Litecoin Price Analysis LTC / USD: Not Enough Traction
LTC is failing to surpass the crucial $100 level.
- Litecoin has a bearish short-term bias, with the LTC / USD pair still trading below major technical resistance on the four-hour time frame
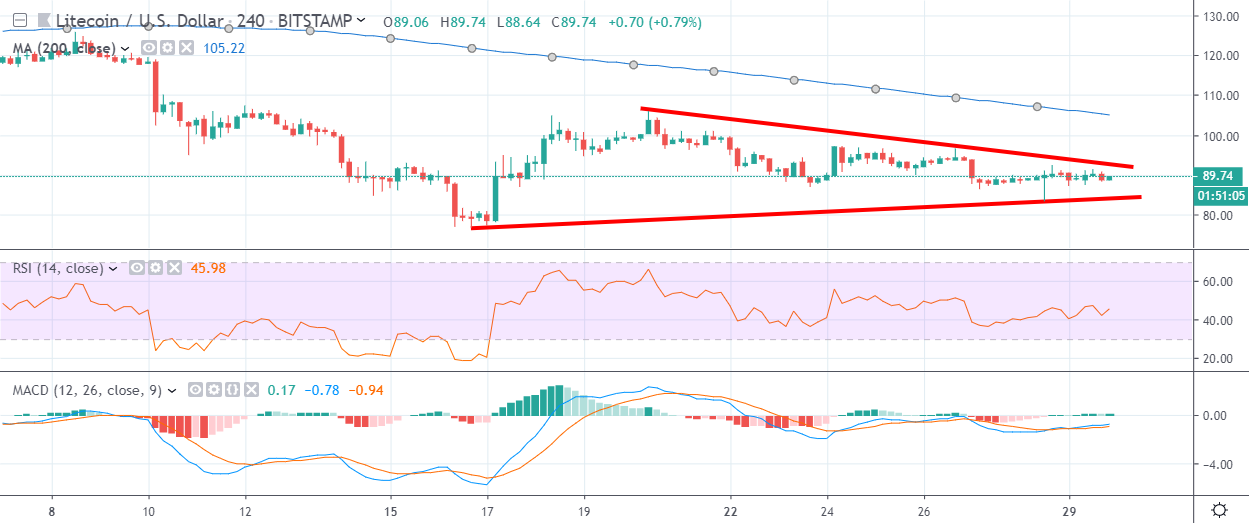
- The four-hour time frame shows that the LTC / USD pair is trapped within a triangle pattern
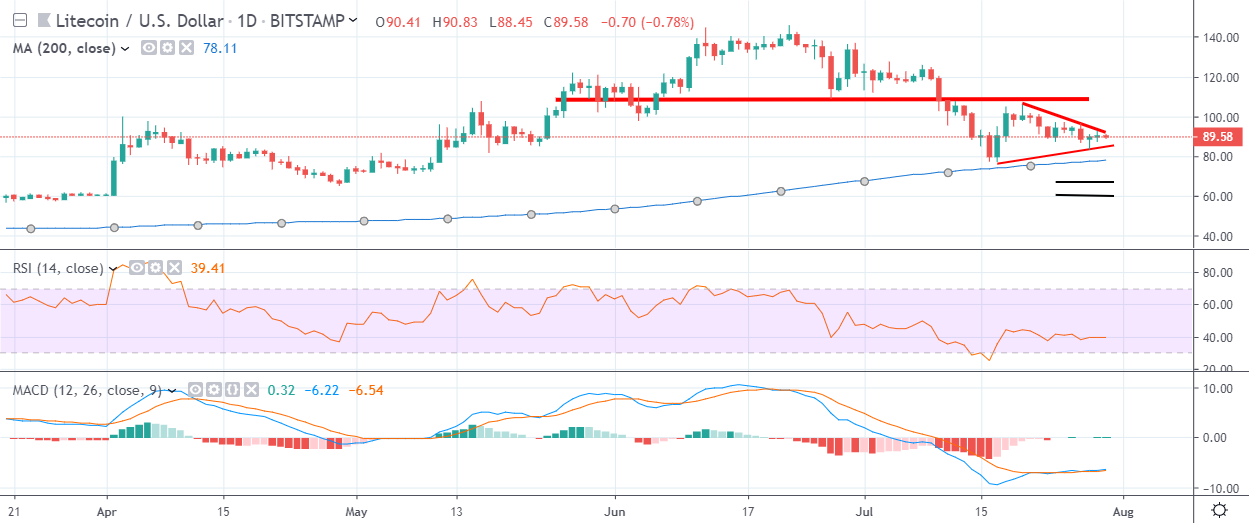
- The daily time frame highlights a bearish head and shoulders pattern with further downside potential
Litecoin / USD Short-term price analysis
Litecoin has a bearish short-term bias, with the LTC / USD pair still trading below major technical resistance on the four-hour time frame.
The four-hour time frame is showing that a neutral triangle pattern has formed, which indicates that a strong directional breakout in the LTC / USD pair is nearing.
Key technical resistance on the four-hour time frame is located at the $100.00 and $107.00 levels.
Technical indicators on the four-hour time frame are neutral and are currently failing to generate a clear trading signal.
Pattern Watch
Traders should note that a bearish breakout from the triangle will likely prompt a move towards the $60.00 level.
Relative Strength Index
The Relative Strength Index on the four-hour time frame is attempting to correct higher, although it remains technically bearish.
MACD Indicator
The MACD indicator is neutral on the four-hour time frame and is currently failing to issue a clear trading signal.
Litecoin / USD Medium-term price analysis
Litecoin has a bullish medium-term trading bias, with the cryptocurrency still holding price above major technical support on the daily time frame.
The daily time frame shows that the LTC / USD pair is consolidating below the neckline of a bearish head and shoulders pattern that has yet to reach its full downside objective.
Key technical support for the LTC / USD pair is currently found at the $66.00 and $60.00 levels.
Technical indicators on the daily time frame are bearish and continue to highlight that the LTC / USD pair remains weak over the medium-term.
Pattern Watch
Traders should note that a neutral triangle pattern has also formed on the daily time frame.
Relative Strength Index
The Relative Strength Index on the daily time frame remains bearish and continues to issue a sell signal.
MACD Indicator
The MACD indicator is bearish on the daily time frame, although it is still trading in oversold territory.
Conclusion
Litecoin remains technically weak across both time frames, with the LTC / USD pair repeatedly failing to gain traction above the psychological $100.00 level.
The four-hour and daily time frame continues to highlight that a continuation of the bearish breakdown should see the LTC / USD pair targeting the $60.00 region.
Check out our coin guide for an introduction to Litecoin.
We also wrote a DARE for the project, analyzing the future prospects of the Bitcoin competitor.