Litecoin Price Analysis LTC / USD: Risk-Reward Opportunity
A bearish technical test presents a risky buy opportunity.

Share this article
- Litecoin has a bearish short-term bias, with the LTC / USD pair trading well below its 200-period moving average on the four-hour time frame
- The four-hour time frame is showing that a bearish head and shoulders pattern has been triggered
- The daily time frame continues to show that a major shift technical shift is currently underway
Litecoin / USD Short-term price analysis
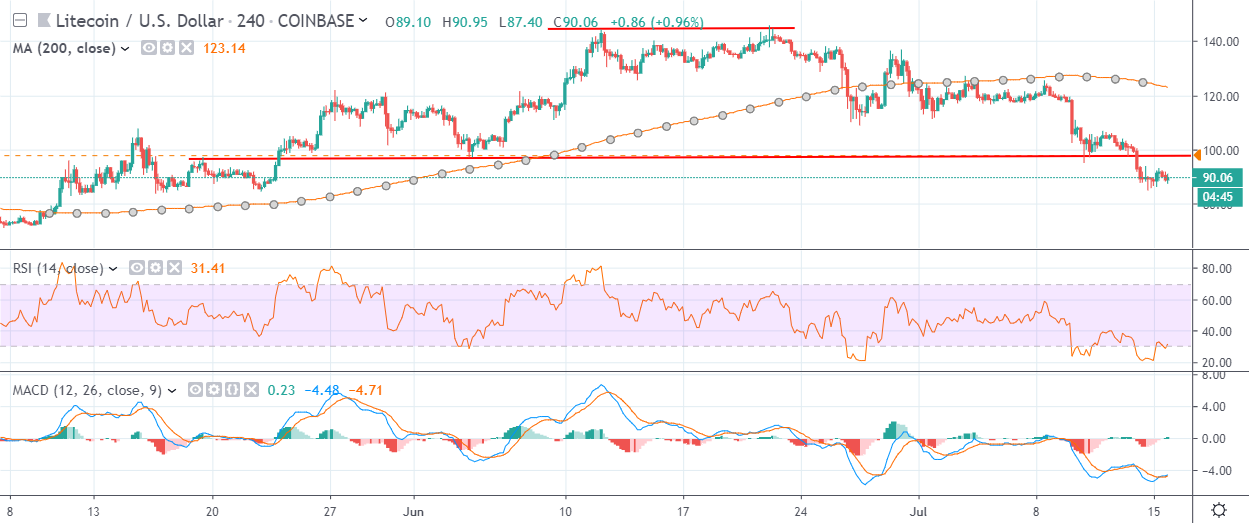
Litecoin has a bearish short-term bias, with the LTC / USD pair trading well below its 200-period moving average on the four-hour time frame.
The four-hour time frame is showing that sellers have now triggered a head and shoulders pattern into action, with the LTC / USD pair holding under the neckline of the bearish pattern.
Key upcoming resistance is located at the $99.00 and $107.00 levels.
Technical indicators on the four-hour time frame continue to point lower, although they remain extremely oversold.
Pattern Watch
Traders should note that the bearish head and shoulders patterns is highlighting the $60.00 level as a possible downside target.
Relative Strength Index
The Relative Strength Indicator on the four-hour time frame is bearish and continues to trade in oversold territory.
MACD Indicator
The MACD indicator is bearish on the four-hour time frame, although it is now extremely oversold.
Litecoin / USD Medium-term price analysis
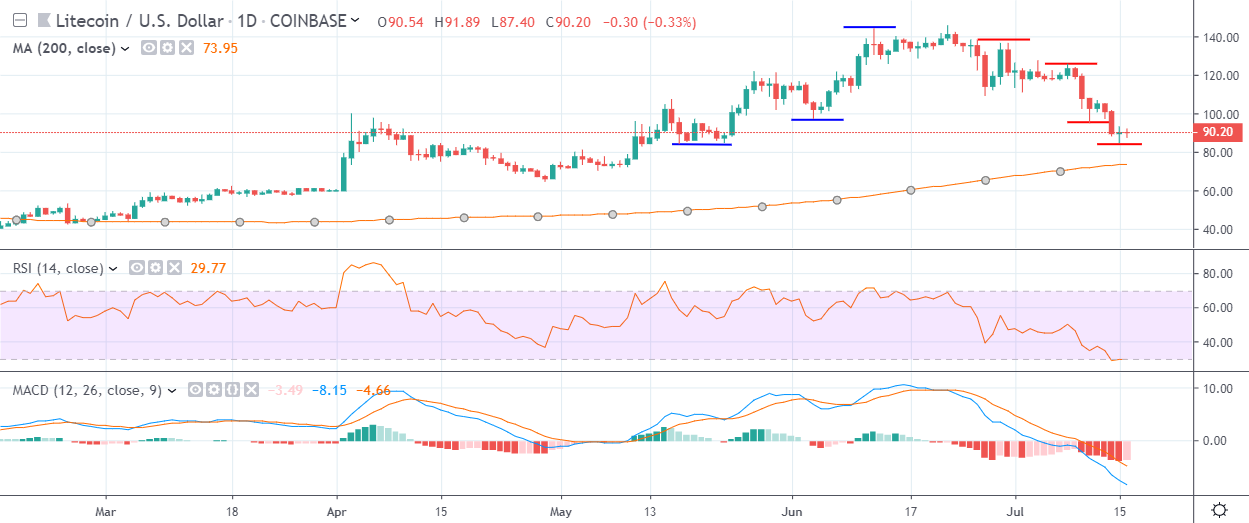
Litecoin has a neutral medium-term trading bias, with the cryptocurrency edging back towards its trend defining 200-period moving average.
The daily time frame shows that the technical dynamics have now shifted in favor of sellers, with price creating bearish lower highs and lower lows.
Key technical support for the LTC / USD pair on the daily time frame is currently found at the $84.00 and $73.00 levels.
Technical indicators on the daily time frame are still pushing lower and continue to issue a strong sell signal.
Pattern Watch
Traders should note that a breach of the May 17th trading low could provoke a major technical test of the LTC / USD pair 200-day moving average.
Relative Strength Index
The Relative Strength indicator on the daily time frame is still bearish, although it is now trading in oversold territory.
MACD Indicator
The MACD indicator remains bearish on the daily time frame and continues to issue a sell signal.
Conclusion
Litecoin remains under severe technical pressure in the short-term, with the cryptocurrency now trading below the neckline of a bearish pattern that has yet to reach its full downside target.
A potential technical test of the LTC / USD pair’s 200-day moving average over the coming trading sessions could present medium-term bulls with an excellent risk-reward entry.
Check out our coin guide for an introduction to Litecoin.
We also wrote a DARE for the project, analyzing the future prospects of the Bitcoin competitor.
Share this article
