
Litecoin Price Analysis LTC / USD: Strict Confinement
LTC's price is trapped between its moving averages.
- Litecoin is trading in its narrowest 21-day range since March this year
- Short-term technical analysis shows a potential bullish pattern taking shape
- The daily time frame highlights that if a rally fails to materialize then the LTC / USD pair could drop towards the $45.00 level
Litecoin is still trapped within an incredibly narrow trading range, after a bullish rally failed to materialize. In fact, the cryptocurrency is trading in its tightest three-week trading band since March this year. An early week rally towards the $73.00 level failed to generate sustainable gains, with the LTC / USD pair soon slipping back under the $70.00 level.
The longer that the LTC / USD pair fails to rally from current trading levels, the greater the chance that we may see the cryptocurrency falling to a new multi-month trading low. A break below the $60.00 support level may provoke an even deeper decline towards the $45.00 level.
In percentage terms, the LTC / USD pair could lose a further twenty-five percent on its value if it does breach the multi-monthly trading low, around the $60.00 level and a decline towards the $45.00 level.
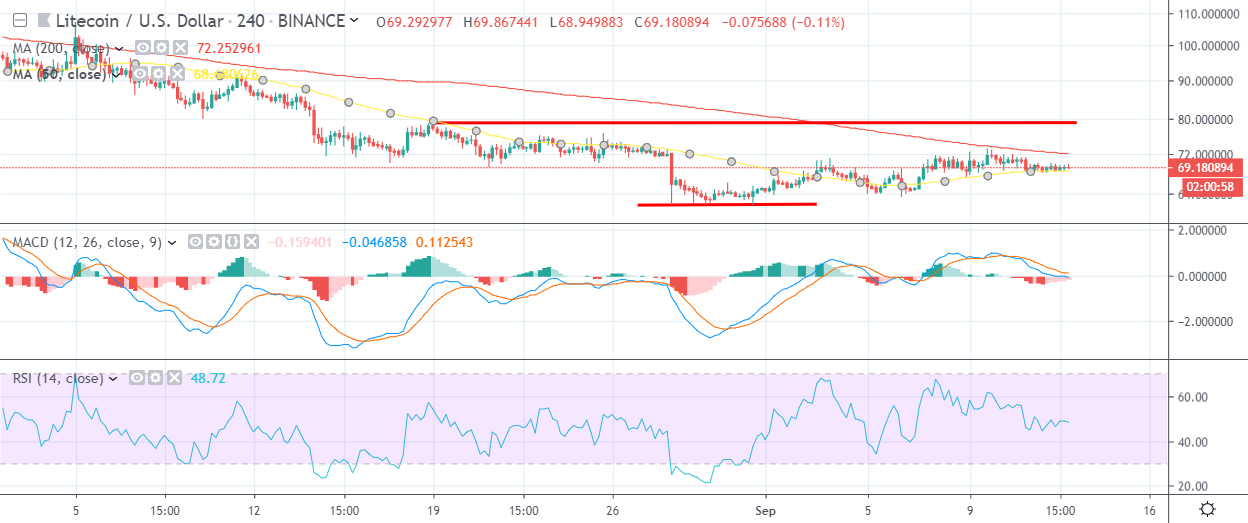
Short-term technical analysis shows that the $68.00 and $65.00 levels are currently the strongest forms of technical support before the $60.00 level starts to come back into focus.
Short-term technical analysis shows a glimmer of hope for LTC / USD bulls, as the four-hour time frame is highlighting a bullish inverted head and shoulders pattern that could form if buyers can rally the cryptocurrency towards the $80.00 resistance level.
The LTC / USD pair’s 200-period moving average on the four-hour time, which is located around the current monthly trading high, is currently the main technical resistance area blocking a rally towards the $80.00 level.
If the bullish pattern is formed around the $80.00 level, the upside projection of the pattern is around $20.00, which would then take the fifth largest cryptocurrency by cap back into triple-digit territory.
According to the latest sentiment data from TheTIE.io, the short-term sentiment towards Litecoin is neutral, at 48.00 %, while the overall long-term sentiment towards the cryptocurrency is considerably more bearish, at 28.00%.
Upside Potential
The four-hour time frame is showing that the $73.00 level is the main technical barrier before the near-term bullish target, at $80.00 starts to come into focus.
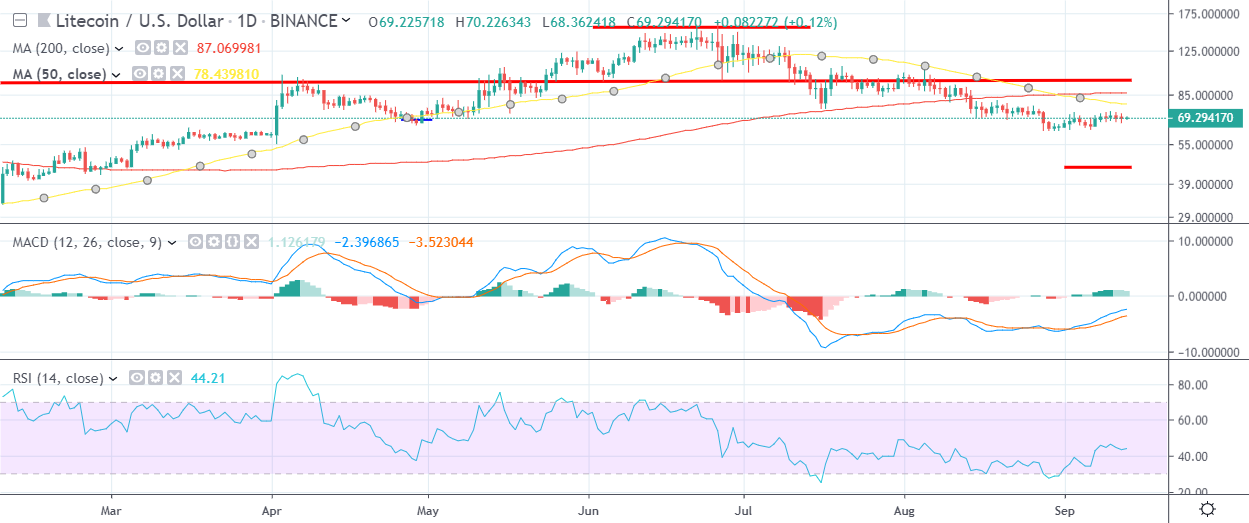
The daily time frame highlights that the LTC / USD pair’s 50-day moving average, at the $80.00 level, is a key technical region which bulls need to break. The cryptocurrency’s 200-day moving average is located at the $87.00 level, and a move above this key technical metric should encourage further LTC / USD buying.
Downside Potential
The four-hour time frame is showing that the LTC / USD pair is currently trapped between the 50-period and 200-period moving averages. The moving averages effectively highlight the next technical breakout zone, between the $68.00 and $73.00 levels.
The daily time frame is showing that the LTC / USD pair is trading below its major long-term moving average, with a bearish death cross currently underway on daily time frame.
Summary
Litecoin will soon need to stage a meaningful short-term rally or the cryptocurrency could see a worrying decline back towards $60.00 support level.
Both time frames highlight the $80.00 level as particularly important if the LTC / USD pair can find short-term buying interest above the $73.00 resistance level.
Check out our coin guide for an introduction to Litecoin.
We also wrote a DARE for the project, analyzing the future prospects of the Bitcoin competitor.