
Litecoin Price Analysis LTC / USD: Treading Water
LTC needs to reach the $96 level to avoid further losses.
- Litecoin is struggling to move price back above the technically important $96.00 level and remains capped below its 200-day moving average
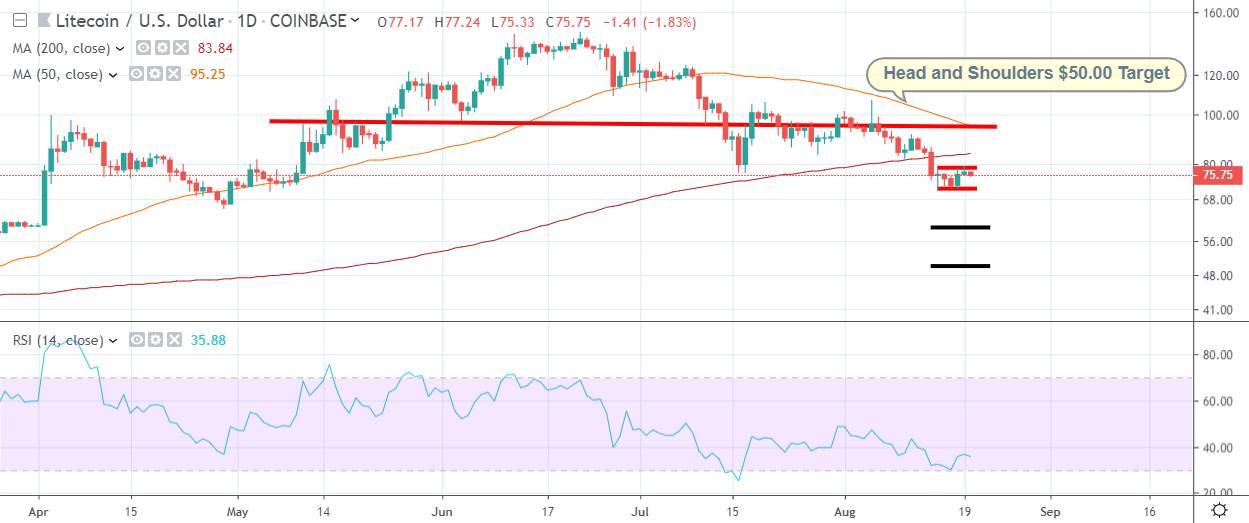
- The daily time frame continues to show a bearish head and shoulders pattern with the $50.00 level as the overall downside target
Litecoin appears relatively unsteady on Tuesday, after the fifth largest cryptocurrency by market capitalization found strong technical resistance from just shy of the $80.00 level. The recent grind higher from the $70.75 level appeared to lack bullish momentum, with the LTC / USD pair so far failing to staging a meaningful rally from depressed levels.
Going forward, the LTC / USD pair is likely to remain technically pressured unless buyers can somehow force price back above the $96.00 resistance level. The $96.00 level is extremely important technically for the LTC / USD pair this week for numerous reasons.
The $96.00 level is the neckline of a large head and shoulders pattern, which could eventually see the LTC / USD pair falling as low as the $50.00 level, according to its overall downside projection. The $96.00 level is also the LTC / USD pair’s 200-period moving average on the four-hour time frame, which remains a key determinant of short-term trading sentiment.
We should also remember that the LTC / USD pair is trading below its 200-day moving average for the first time since February this year, so the short and medium-term trend for the Litecoin has now officially flipped to bearish.
According to the latest sentiment data from TheTIE.io, the short-term sentiment towards Litecoin is slightly bearish, at 48.48 %, while the overall long-term sentiment towards the cryptocurrency is also negative, at 46.31%.
Upside Potential
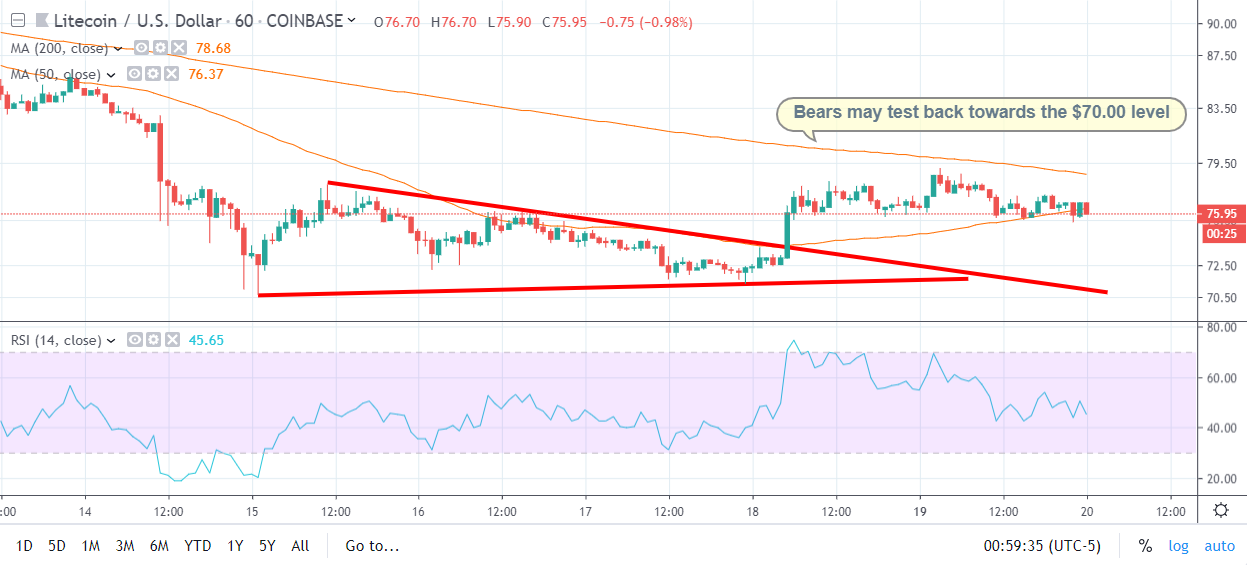
The one-hour time frame is showing that if bulls break above the $80.00 resistance level, then a move towards the $90.00 level appears likely due to emergence of a small inverted head and shoulders pattern with a $10.00 upside projection.
The daily time frame highlights the recent price consolidation inside a tight $10.00 price range, with the LTC / USD pair’s 200-day moving average located slightly above the top of the recent price range, at $83.65. If bulls can gain strength above this level, we should expect bulls to possibly mount a challenge towards the $96.00 level.
Downside Potential
The downside potential for the LTC / USD pair can really start to open-up this week if sellers move price under the $70.00 support level. The one-hour time frame continues to highlight that critical trendline support is located around the current monthly trading low.
The daily time frame is also highlighting that the LTC / USD pair continues to trade below the neckline of a large head and shoulders pattern, with a downside projection of around $50.00. A move below the $70.00 level is likely to quickly increase technical selling towards the $60.00 level, although the down move is likely to extend down towards the $50.00 support level.
Summary
Litecoin is vulnerable to more downside while trading below the $96.00 level. Bulls must stabilize price above the pair’s 200-day moving average to try to encourage a fresh wave of technical buying.
Overall, if the $70.00 support level is broken this week, the LTC / USD pair could see a much deeper decline towards the $50.00 level.
Check out our coin guide for an introduction to Litecoin.
We also wrote a DARE for the project, analyzing the future prospects of the Bitcoin competitor.