
Litecoin Price Analysis LTC / USD: Shooting Higher
Litecoin is recovering towards the best levels of the year, getting ready to move higher onto $130 and $180 targets.
- Litecoin has a bullish short-term trading bias, with the cryptocurrency testing towards the best levels of 2019
- The four-hour time frame is now showing a large bullish pattern
- The daily time frame continues to show the $180.00 level as a possible upside target
Litecoin / USD Short-term price analysis
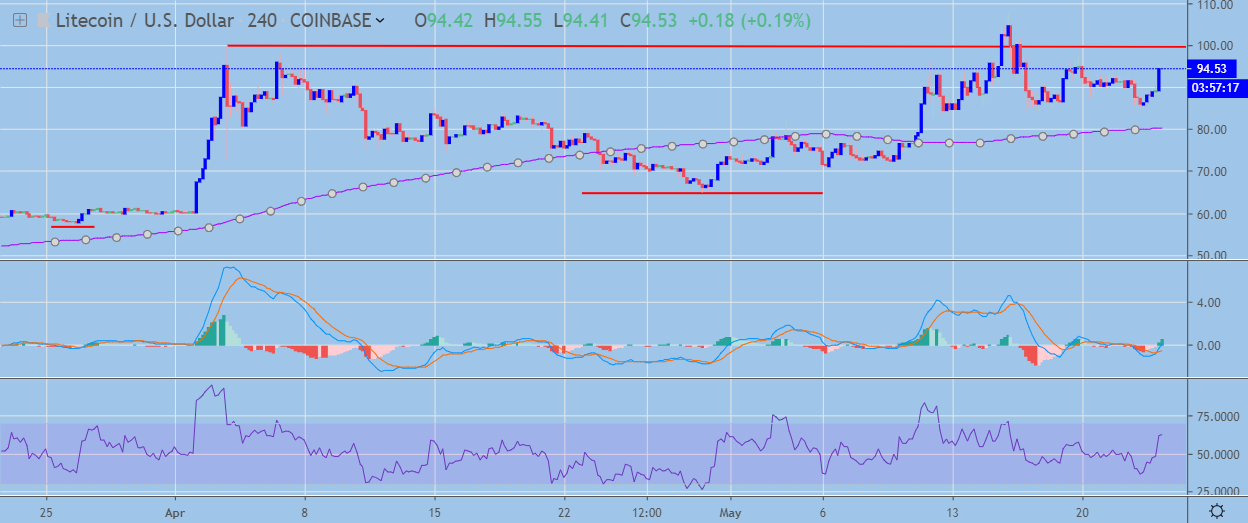
Litecoin has a bullish short-term trading outlook, with the LTC / USD pair recovering back towards the best levels of 2019 year so far.
The four-hour time frame now shows an inverted head and shoulders pattern, with LTC / USD buyers probing towards the neckline of the bullish pattern.
Technical indicators on the four-hour time frame have turned bullish and continue to issue strong buy signals.
 LTC / USD H4 Chart by TradingView
Pattern Watch
Traders should note that the $135.00 level is the initial upside target of the inverted head and shoulders pattern on the four-hour time frame .
Relative Strength Index
The Relative Strength Index is bullish on the four-hour time frame and highlights growing short-term upside momentum.
MACD Indicator
The MACD indicator is bullish on the four-hour time frame and continues to issue a strong buy signal.
Litecoin / USD Medium-term price analysis
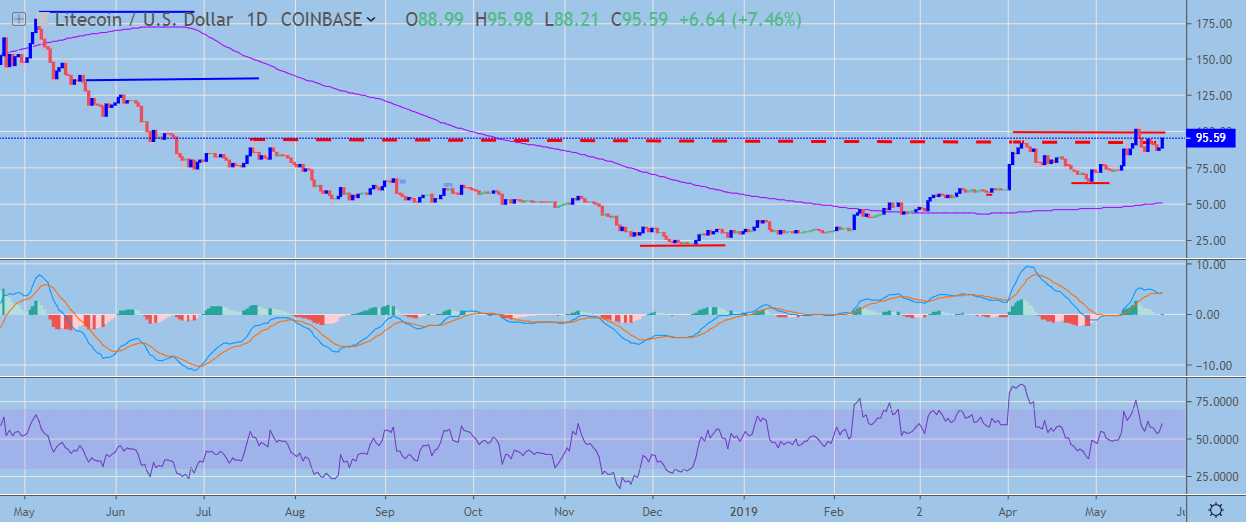
Litecoin still has a bullish medium-term trading bias, with the cryptocurrency once again attempting a major technical breakout on the daily time frame.
The daily time frame is now showing a smaller inverted head and shoulders pattern and a much larger inverted head and shoulders pattern.
Technical indicators on the daily time frame remain bullish and show scope for further upside.
 LTC / USD Daily Chart by TradingView
Pattern Watch
Traders should note that the $180.00 level is the upside target of the larger inverted head and shoulders pattern on the daily time frame.
Relative Strength Index
The Relative Strength indicator also remains bullish on the daily time frame and highlights the growing medium-term buying interest.
MACD Indicator
The MACD indicator is bullish on the daily time frame and shows scope for further upside.
Conclusion
Litecoin remains extremely well supported on any moves lower, with the LTC / USD bulls poised to attack the current 2019 trading high.
The four-hour time frame points to a possible breakout move towards the $135.00 level, whilst the daily time frame continues to highlight the $180.00 level as an initial medium-term upside target.
Check out our coin guide for an introduction to Litecoin.
We also wrote a DARE for the project, analyzing the future prospects of the Bitcoin competitor.