 Earn with Nexo

LTC / USD Price Analysis: No Shame In Record-Breaking Second Place
Litecoin has an overwhelmingly bullish outlook on all time frames, getting ready to break the $100 mark.
- Litecoin, often described as the ‘silver to Bitcoin’s gold’, has a bullish short-term trading bias, with the cryptocurrency testing back towards the best levels of the year
- The LTC / USD pair has a strong bullish outlook over the medium-term horizon
- Bullish inverted head and shoulders patterns have formed across the four-hour and daily time frames
Litecoin / USD Short-term price analysis
Litecoin has a bullish short-term trading outlook, with the LTC / USD pair now testing back towards the best levels of the year so far.
The four-hour time frame is showing that the recent upside recovery in the LTC / USD pair has helped generate a bullish inverted head and shoulders pattern.
Technical indicators on the four-hour time frame have turned bullish and continue to issue bullish signals.
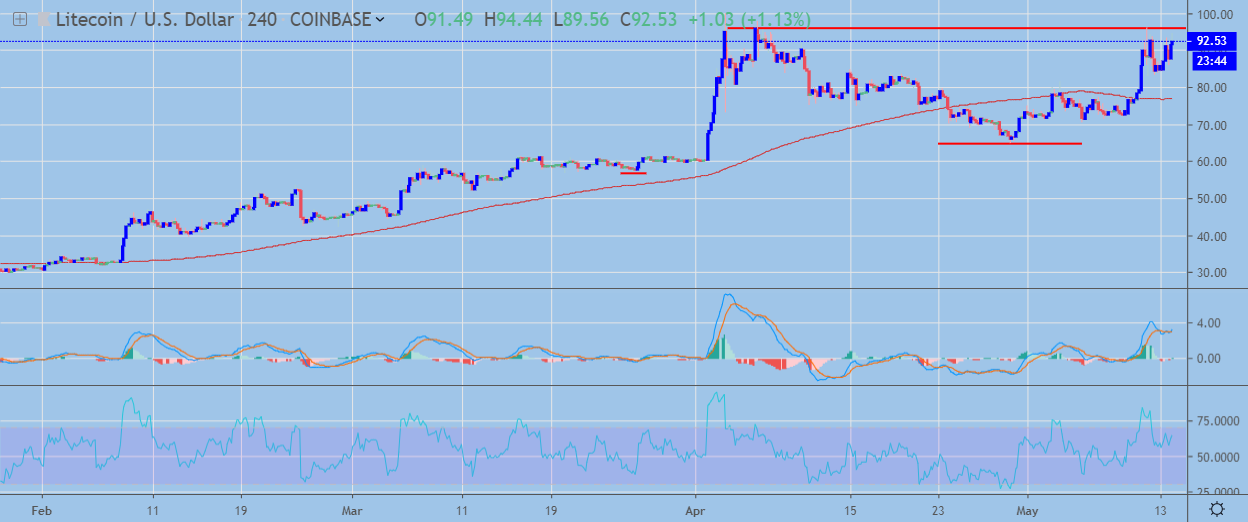 LTC / USD H4 Chart by TradingView
Pattern Watch
Traders should note that the inverted head and shoulders pattern on the four-hour time frame is targeting a $30.00 gain.
Relative Strength Index
The Relative Strength indicator is bullish on the four-hour time frame and shows scope for further upside.
MACD Indicator
The MACD indicator is bullish on the four-hour time frame and continues to issue a buy signal.
Litecoin / USD Medium-term price analysis
Litecoin has an increasingly bullish medium-term trading outlook, with the cryptocurrency attempting a major upside technical breakout.
The daily time frame is showing that the LTC / USD pair is now testing back towards the neckline of the large inverted head and shoulders pattern, with the bullish pattern holding an upside projection of over $70.00.
Technical indicators on the daily time frame have turned bullish and continue to generate buy signals.
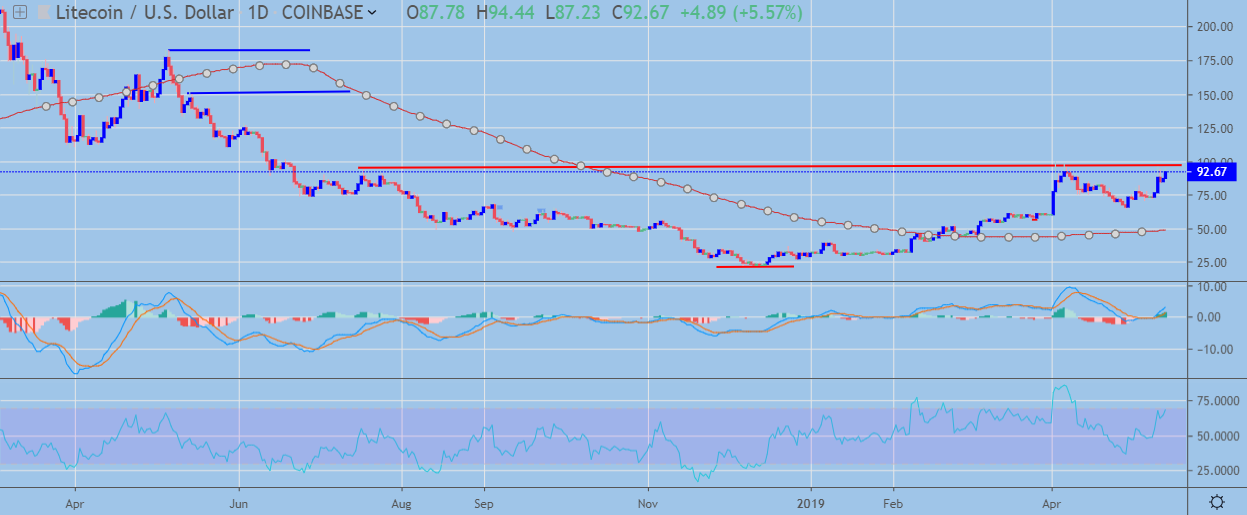 LTC / USD Daily Chart by TradingView
Pattern Watch
Traders should note that a much larger inverted head and shoulders pattern could start to form on the daily time frame.
Relative Strength Index
The Relative Strength indicator has turned bullish on the daily time frame and shows scope for further upside.
MACD Indicator
The MACD indicator has turned bullish on the daily time frame, with the MACD signal line continuing to issue a buy signal.
Conclusion
Litecoin is testing back towards the best levels of the year so far, with the four-hour time frame pointing to a possible breakout move towards the $125.00 level.
The daily time frame is highlighting that a much larger upside breakout could occur, with the $165.00 and $185.00 levels as possible bullish targets.
Check out our coin guide for an introduction to Litecoin.
We also wrote a DARE for the project, perfect to get up to speed on its advantages and risks.