
Shutterstock cover by Oleg Znamenskiy
Markets Lift Bitcoin, Leaving Ethereum for the Bears
While Bitcoin looks unstoppable at the current price levels, Ethereum seems bound to retrace before its uptrend resumes.
Chinese tech giant Meitu announced the additional purchase of 386 BTC and 16,000 ETH. While the spike in buying upward pressure was quickly reflected in prices, Bitcoin and Ethereum present opposing outlooks.
Bitcoin Whales Make Network Splash
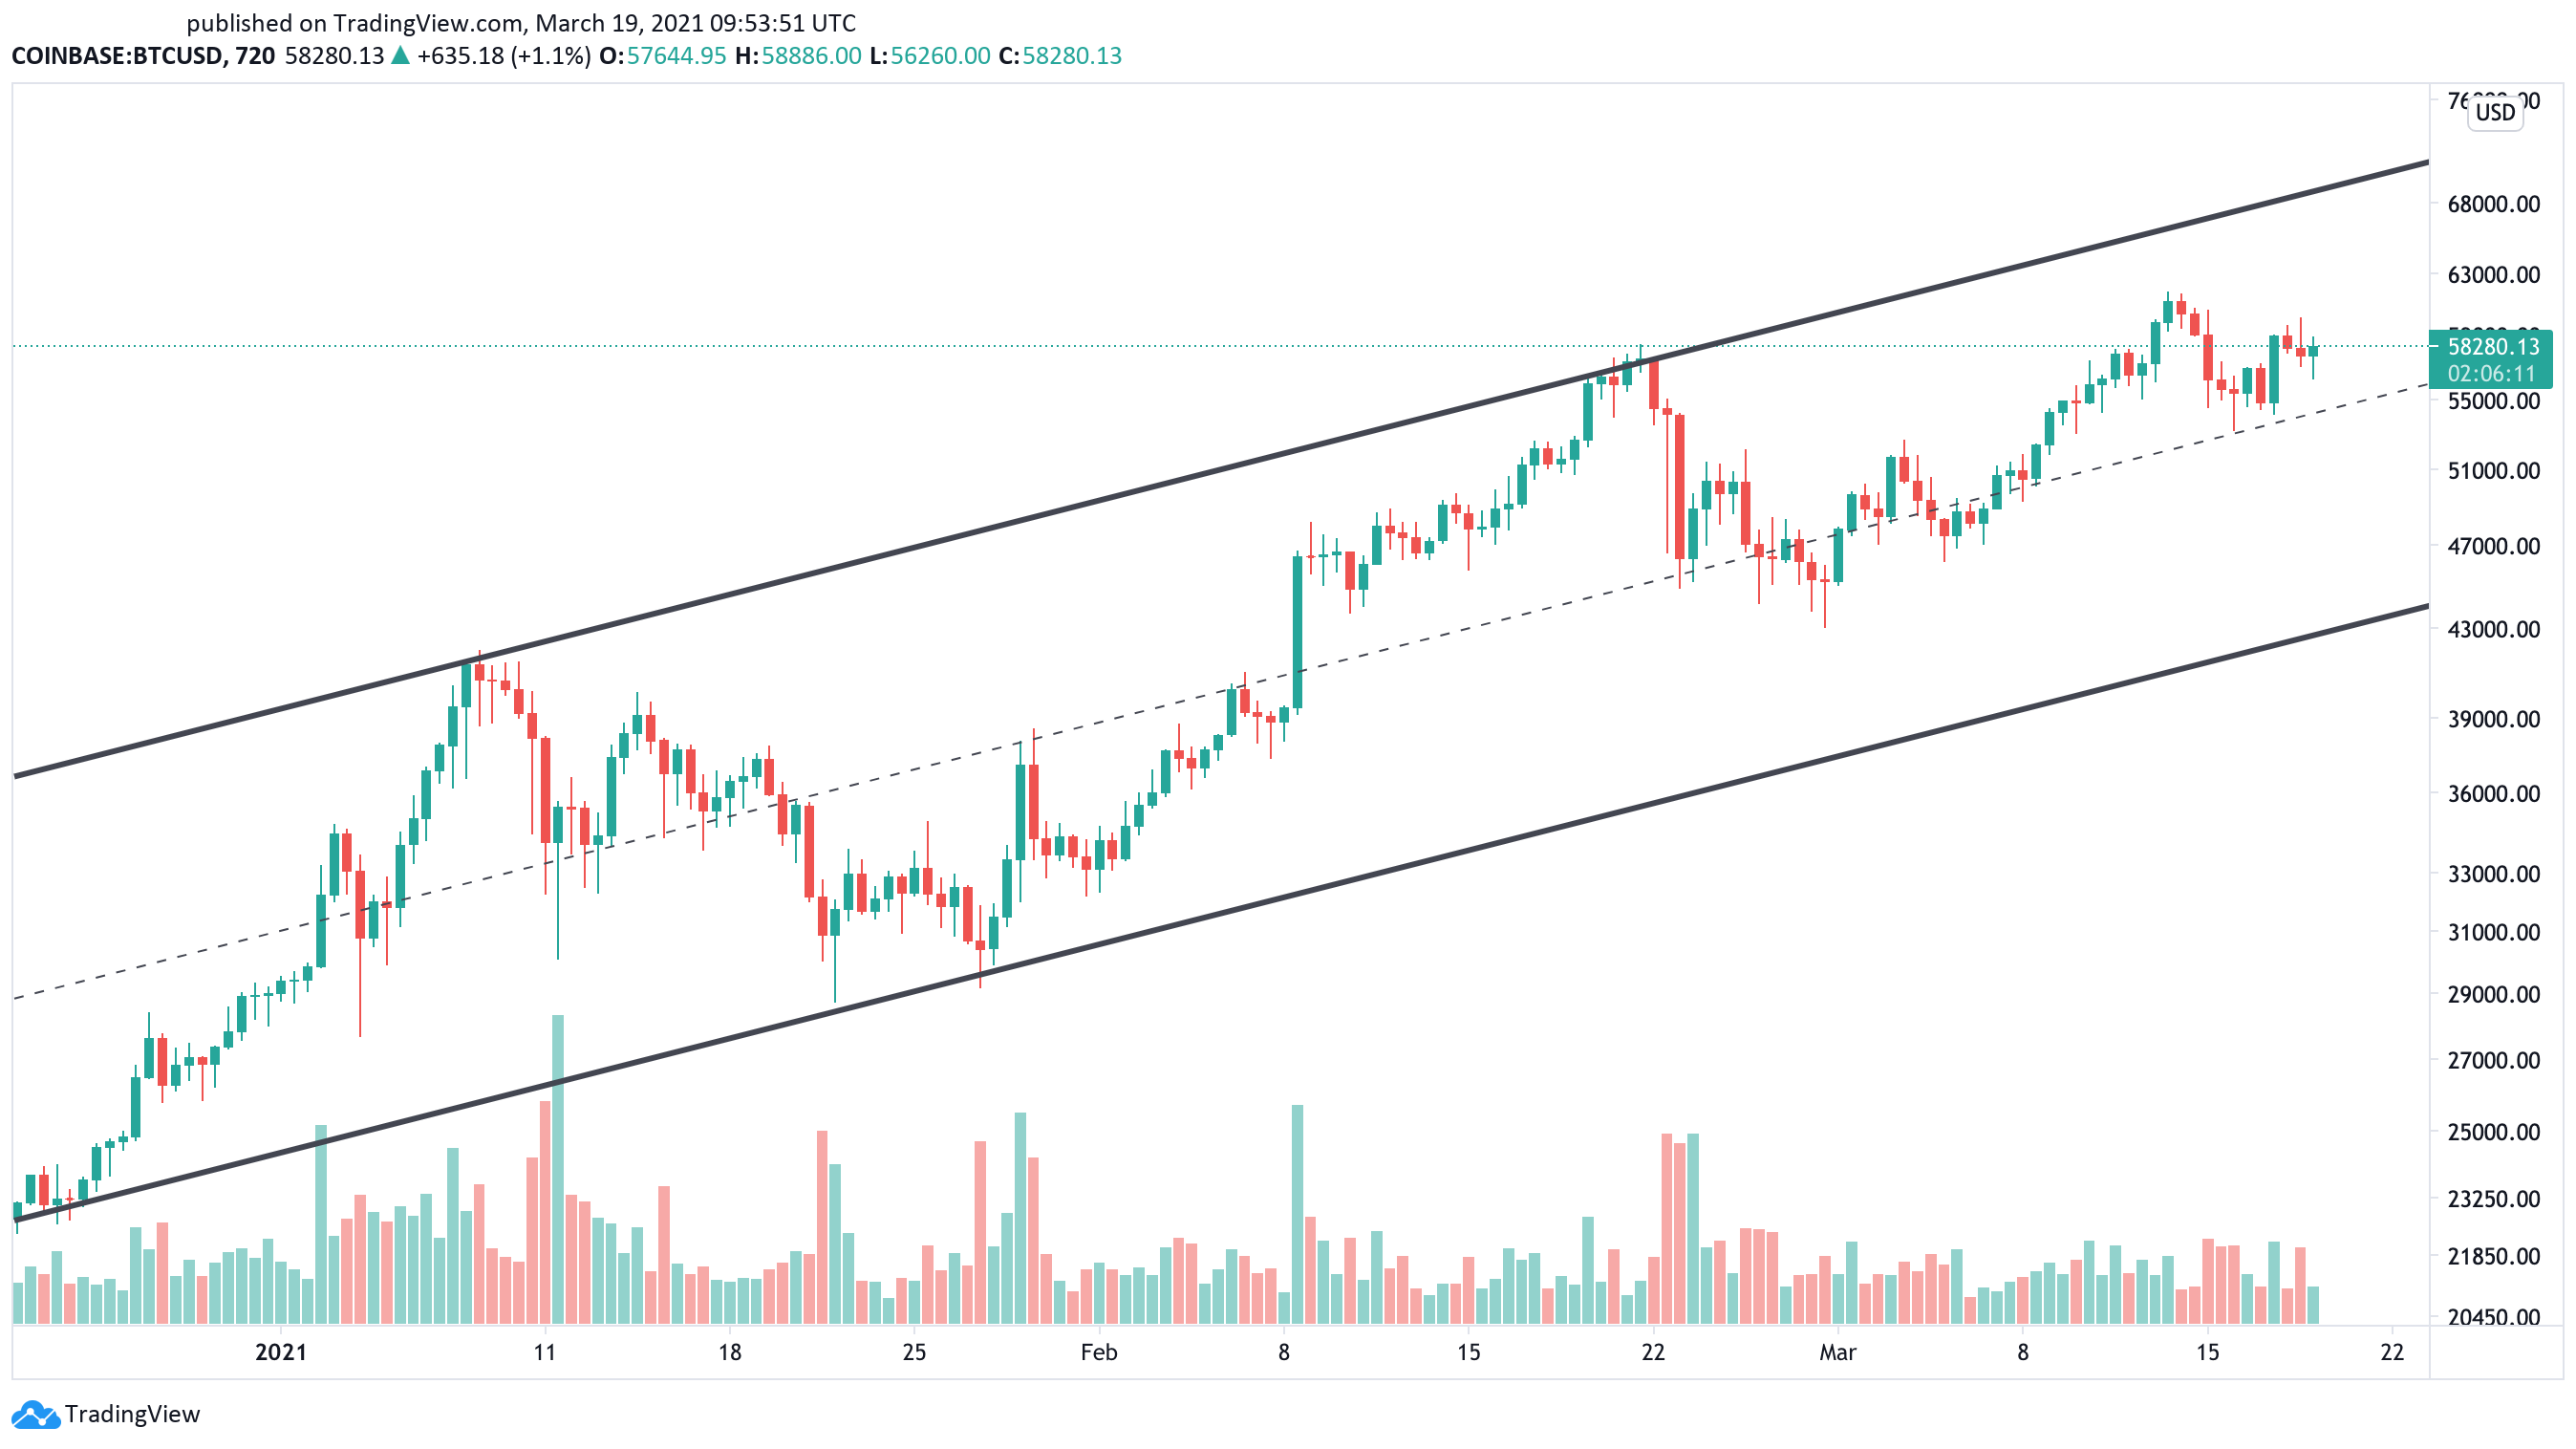
Bitcoin’s impressive price action has been contained within an ascending parallel channel since late December 2020.
Each time BTC has risen to this technical formation’s upper boundary since then, it gets rejected and retraces to the lower edge. From this point, it tends to rebound, consistent with a channel’s characteristics.
Following the recent retest of the channel’s middle trendline, Bitcoin bounced off this support level and avoided a steep correction to $46,000.
Given institutional investors’ rising interest, it is reasonable to assume that a spike in buying pressure could see BTC rise towards the channel’s upper boundary at $70,000.
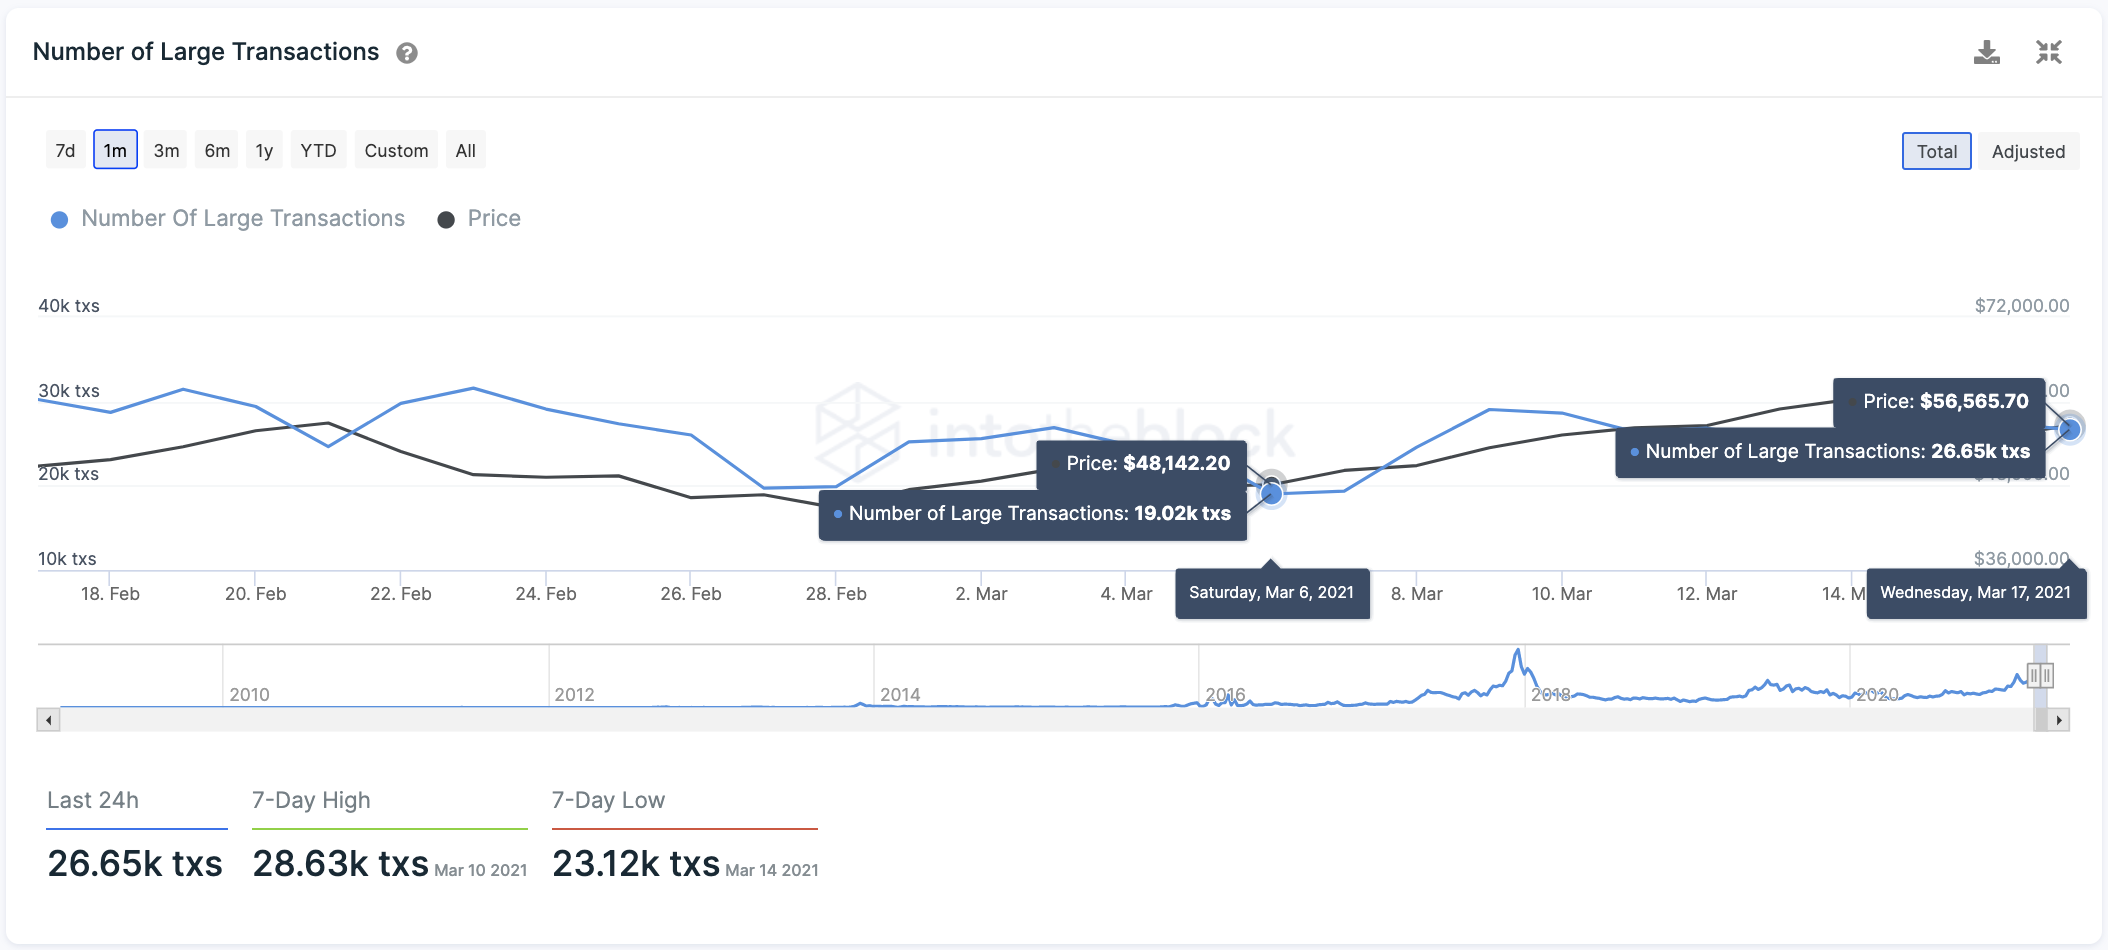
When looking at the capital movement of holders who own millions of dollars of Bitcoin, colloquially known as whales, the odds seem to favor the bulls.
The number of on-chain transactions with a value greater than $100,000 has risen by nearly 37% over the past ten days. Indeed, large transactions have increased from a low 19,000 on Mar. 6 to nearly 27,000 transactions per day.
Historical data suggests that when the number of large transactions on the Bitcoin network starts to increase, prices follow. If this metric pushes for higher highs, BTC will be on track for a new price record.
IntoTheBlock’s In/Out of the Money Around Price (IOMAP) model reveals that over 95% of all BTC tokens in circulation were acquired at a lower price than Bitcoin’s current market value. Only 4.60% of these coins were bought at a higher level.
These figures indicate that most of the investor base behind Bitcoin is “In the Money,” and it will take a significant amount of selling pressure to push prices lower.
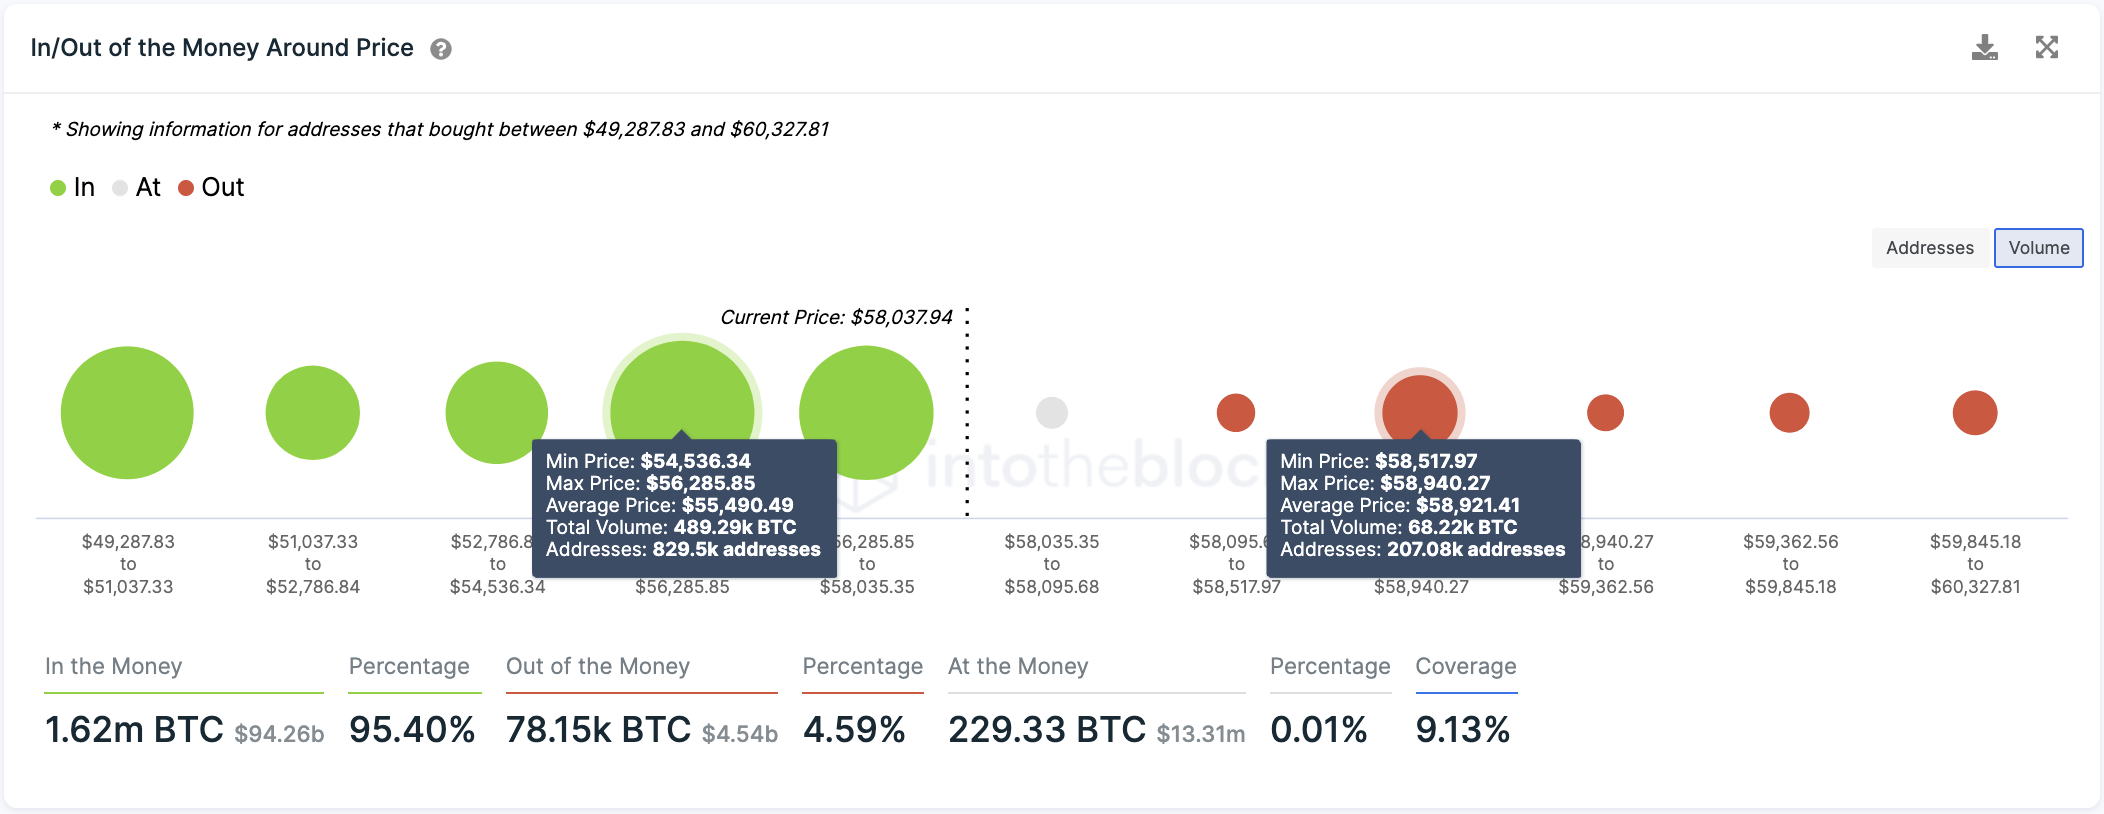
Nonetheless, an unforeseen event that causes panic selling among investors will likely be contained by the $55,500 level. Nearly 830,000 addresses had previously purchased 490,000 BTC around this price zone, providing Bitcoin’s uptrend significant support.
Only a daily candlestick close below $55,500 might put on hold the bull rally and lead to a correction to $50,000.
Ethereum Leans Bearish as Selling Pressure Mounts
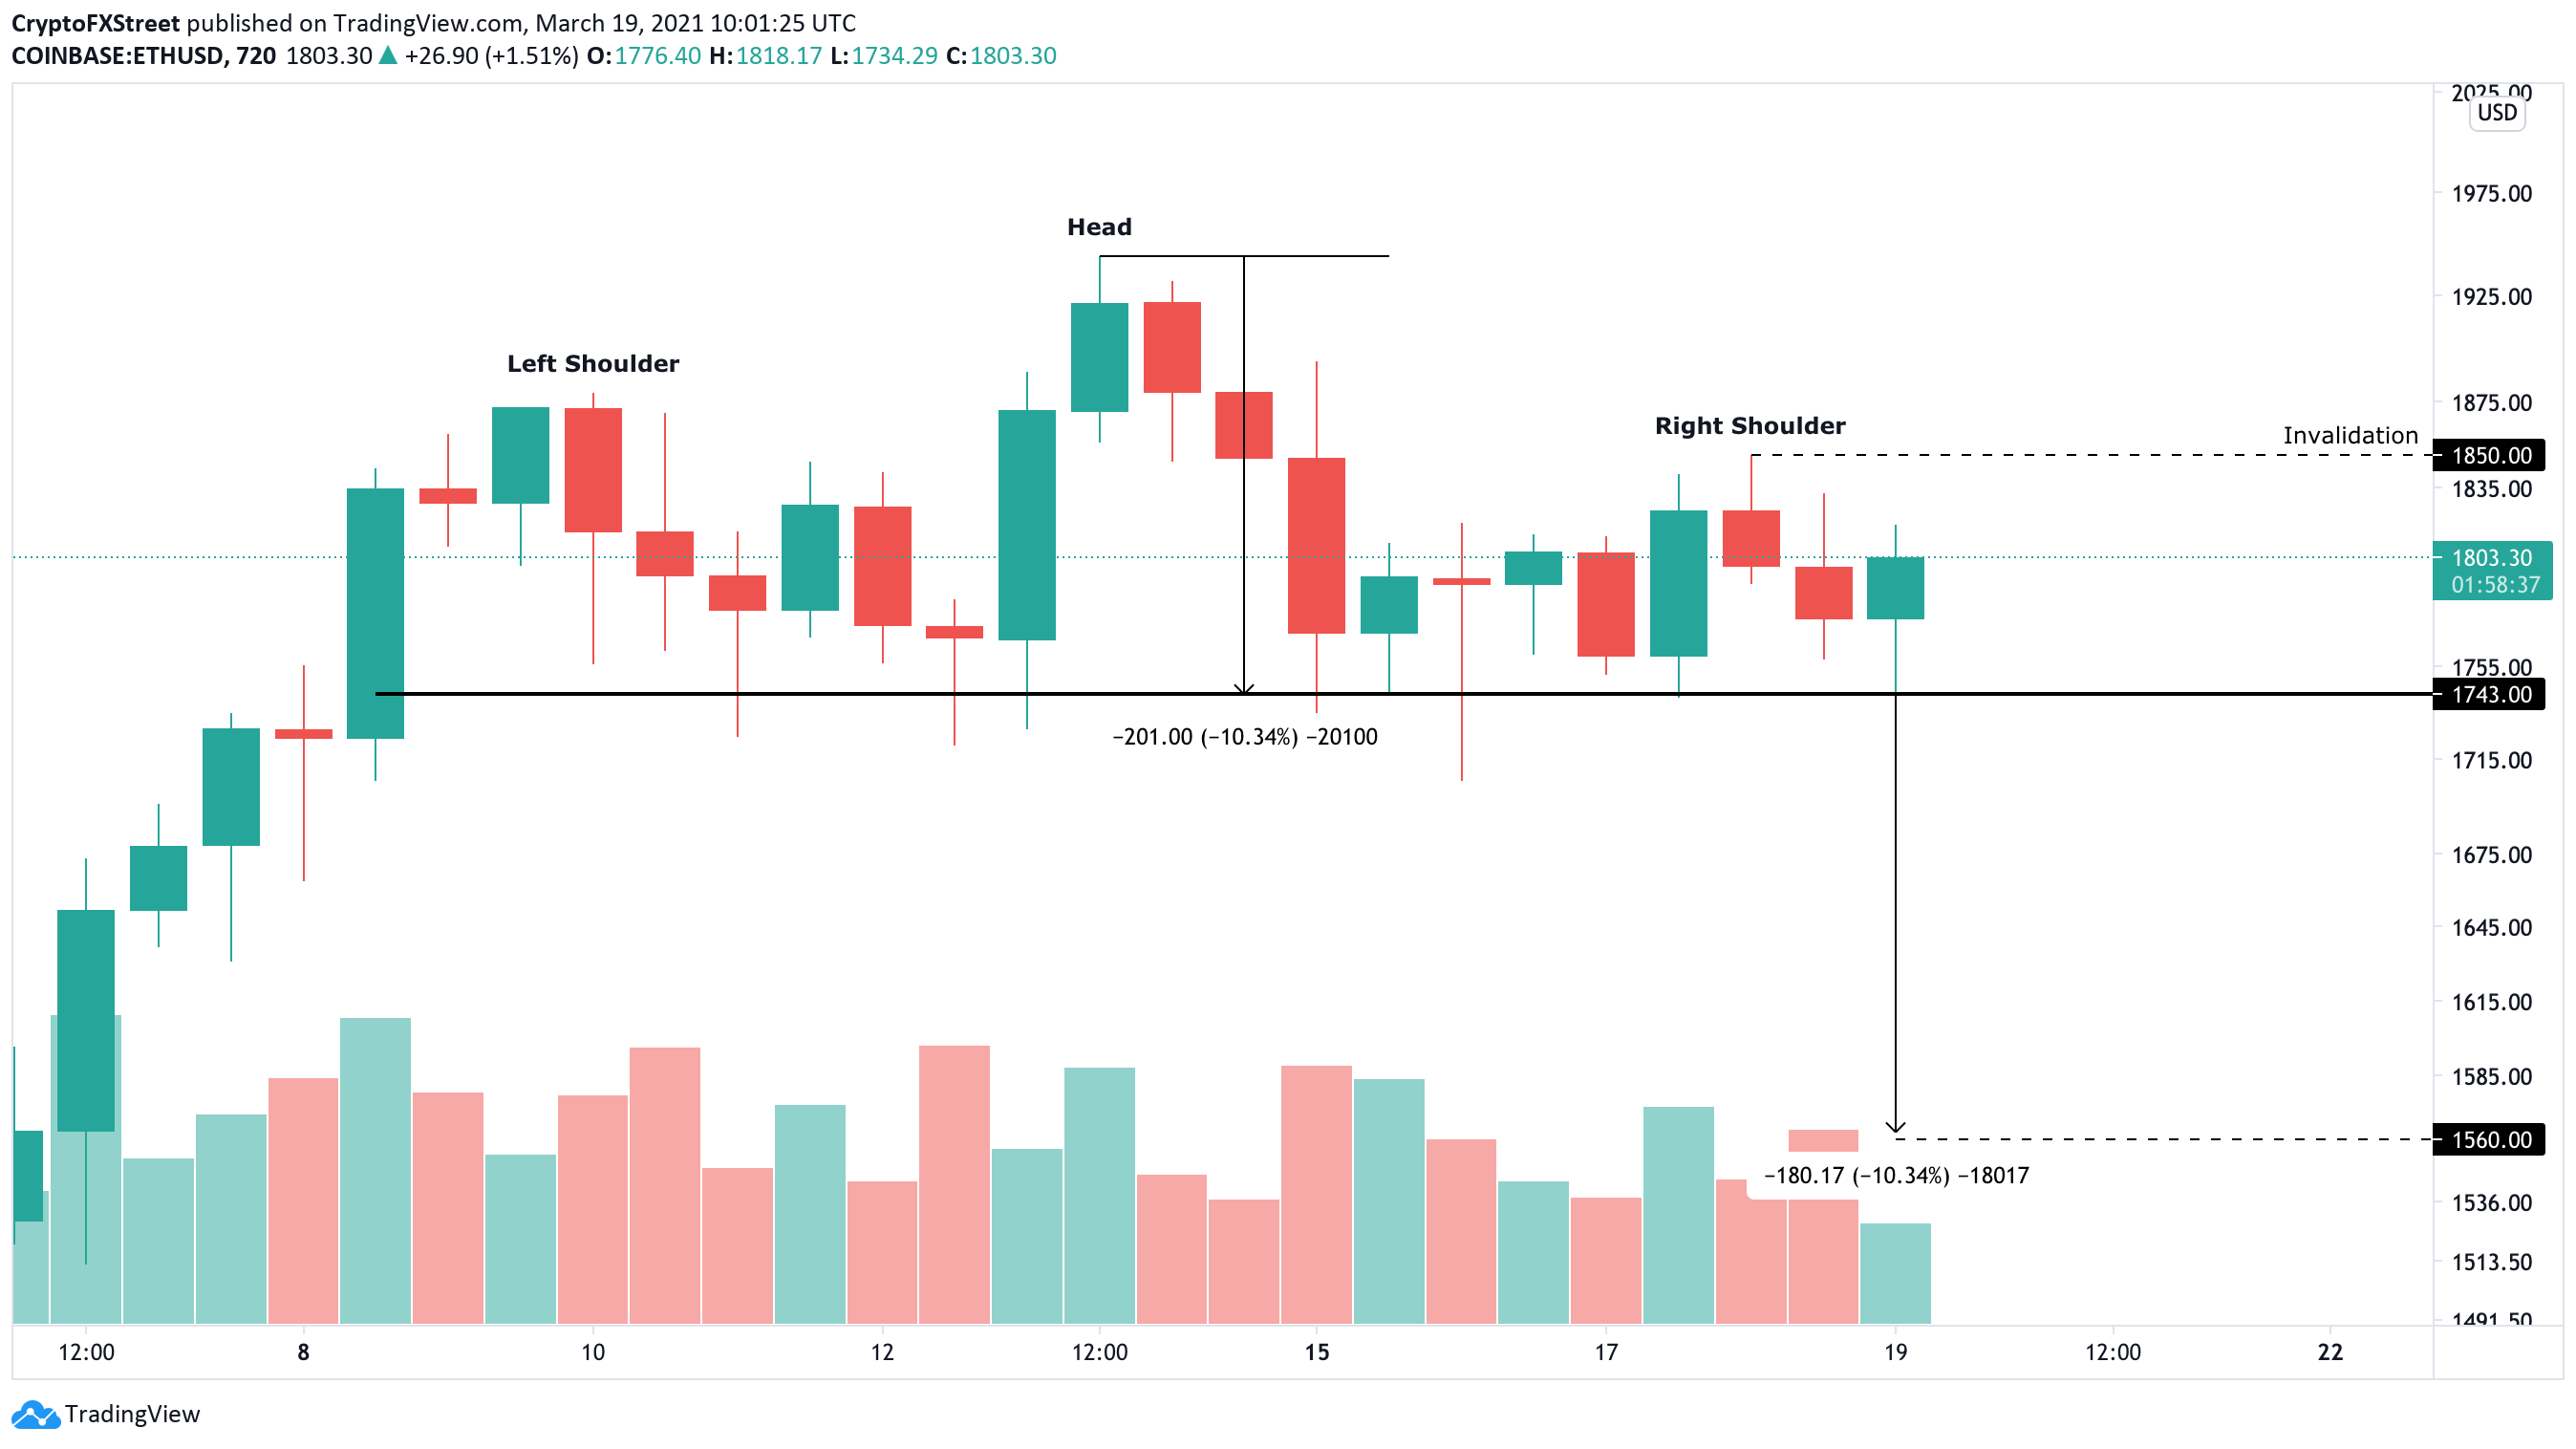
Ethereum appears to be developing a head-and-shoulders pattern on its 12-hour chart following a ten-day-long consolidation period. A downswing to the setup’s neckline at $1,740 will help create the right shoulder.
This technical pattern estimates that a spike in selling pressure behind could lead to a steep correction upon forming the right shoulder. Slicing through the $1,740 support level might see Ether’s market value drop by 10% towards, which puts ETH at a target of $1,560
This target is determined by measuring the distance between the pattern’s head and the neckline and adding it to the breakout point.
Given the probability of a downswing, it seems like large investors have been offloading some of their ETH bags to rebuy this token at a discount.
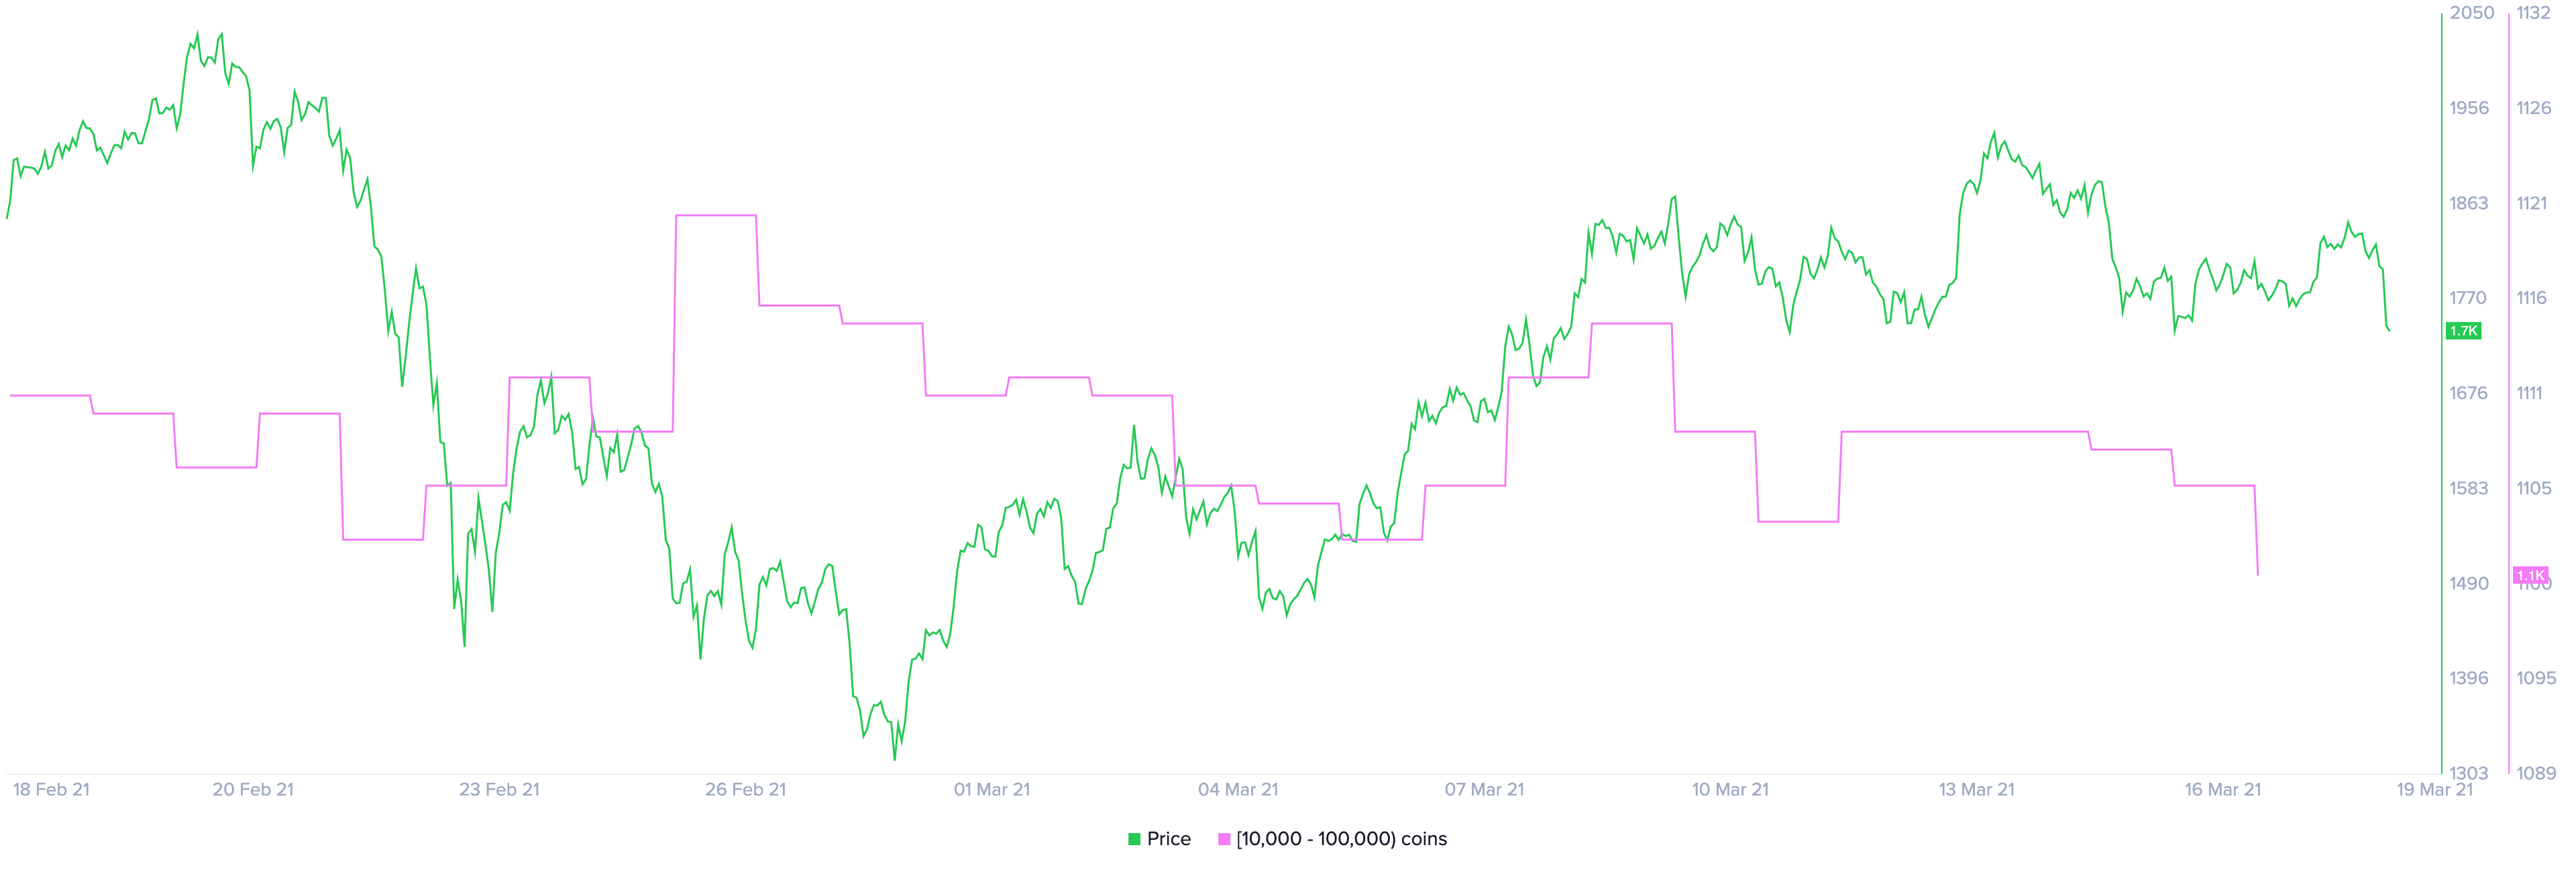
Santiment’s holder distribution chart shows that the selling pressure behind Ethereum rose dramatically over the past week. The number of addresses holding 10,000 to 100,000 ETH dropped. Roughly 14 whales left the network or redistributed their tokens, representing a 1.2% decline in such a short period.
At first glance, the recent decrease in the number of large investors behind Ether may seem insignificant. When considering that these whales hold between $18 million and $180 million in Ether, the sudden increase in downward pressure can translate into millions of dollars.
Still, transaction history shows that Ethereum sits on top of a large demand wall with little to no resistance.
Roughly 1 million addresses had previously purchased more than 14 million ETH between $1,770 and $1,830. Such a massive interest area might have the ability to absorb any selling pressure behind this altcoin. But breaking through it will confirm the head-and-shoulders pattern’s bearish outlook.
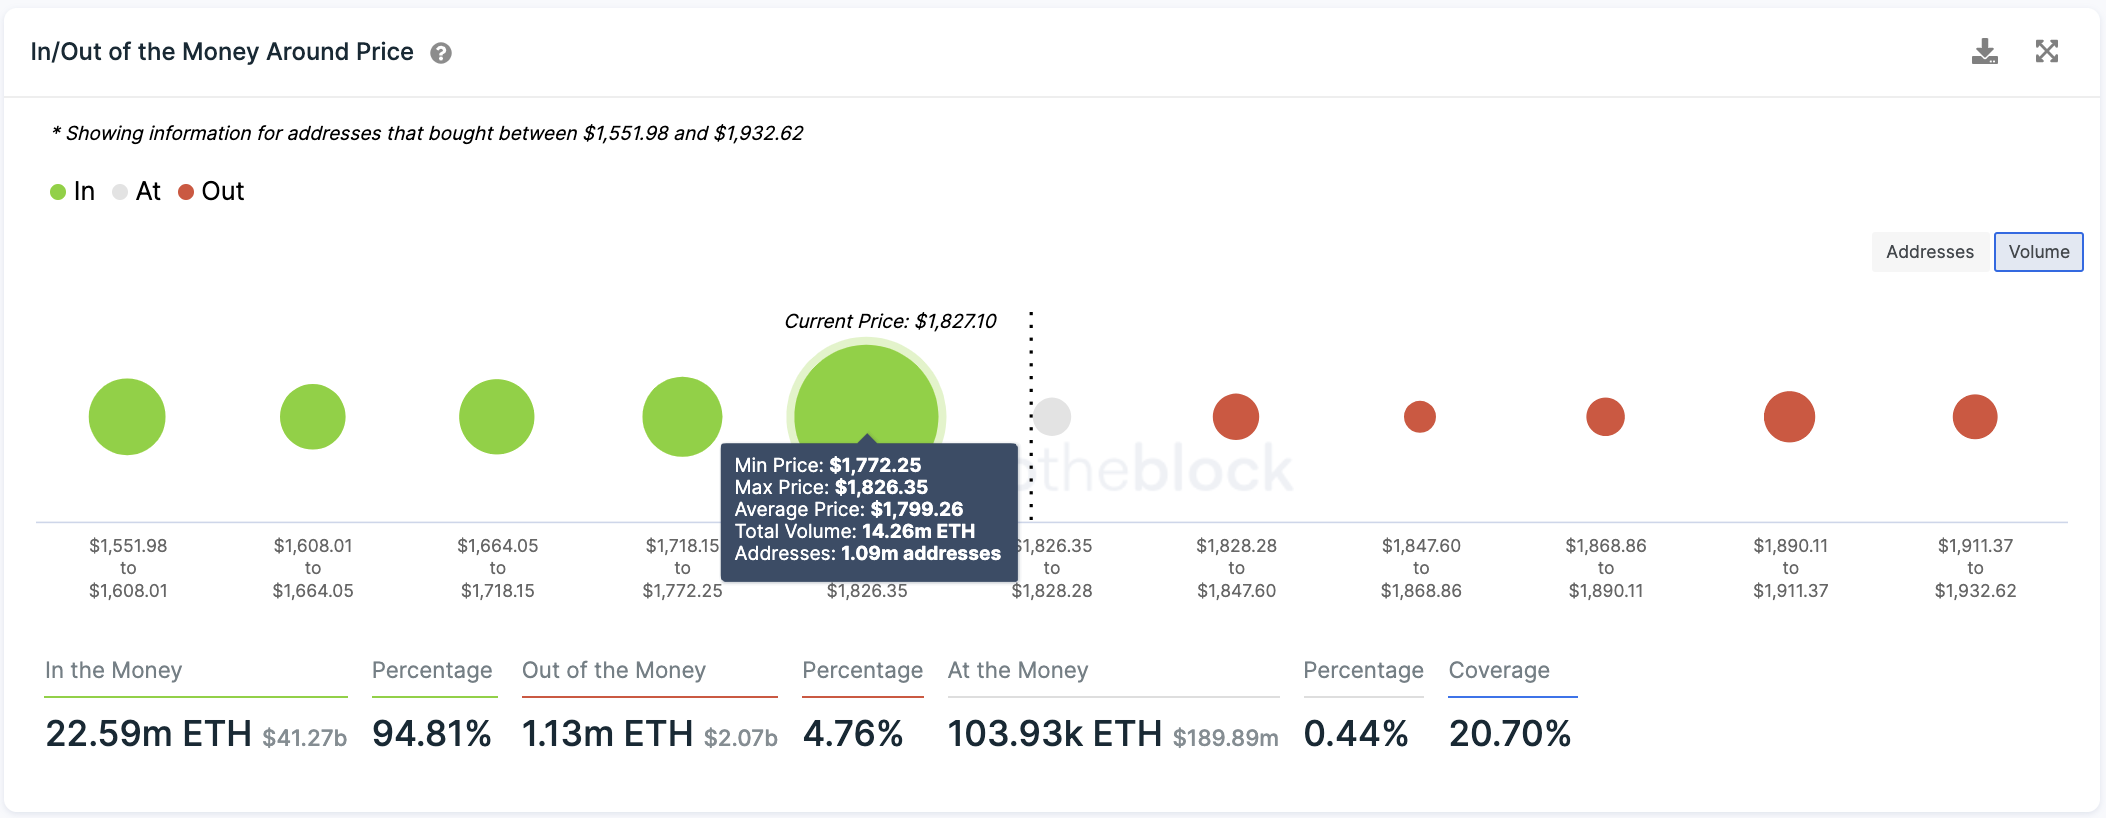
It is worth noting that as long as Ethereum can hold above the $1,800 demand barrier, the bearish outlook will be put on hold.
If buy orders were to increase around this price level, then ETH will likely retest all-time highs given the lack of resistance levels ahead.
Disclosure: At the time of writing, this author owned Bitcoin and Ethereum.