Polygon Primed to Tumble After Nine-Month Consolidation
MATIC has had a difficult few weeks, and it looks ready to dip lower.

Key Takeaways
- MATIC appears to be breaking down of a descending triangle.
- Breaching the $1.80 support level could ignite an 87% bear market.
- MATIC needs to regain $2.90 as support. Failing to reclaim this level could result in another downturn.
Share this article
Polygon’s MATIC token looks poised to slide as it threatens to breach a crucial area of support. With nearly all financial markets in the red, Polygon bulls face a tough challenge ahead.
Polygon Looks Ready to Bleed
It looks like the pain isn’t over for Polygon.
As global markets slide, the Ethereum scaling solution’s MATIC token appears to be breaking down after enduring a nine-month-long consolidation period.
Polygon was one of the early stars of the 2021 bull market. MATIC rallied and the network saw rapid user growth near the start of the year as Ethereum-native DeFi projects like Aave and Curve expanded to the network. While it achieved a record high of $2.92 in late December, it has had a rocky start to 2022, trending down to $1.82.
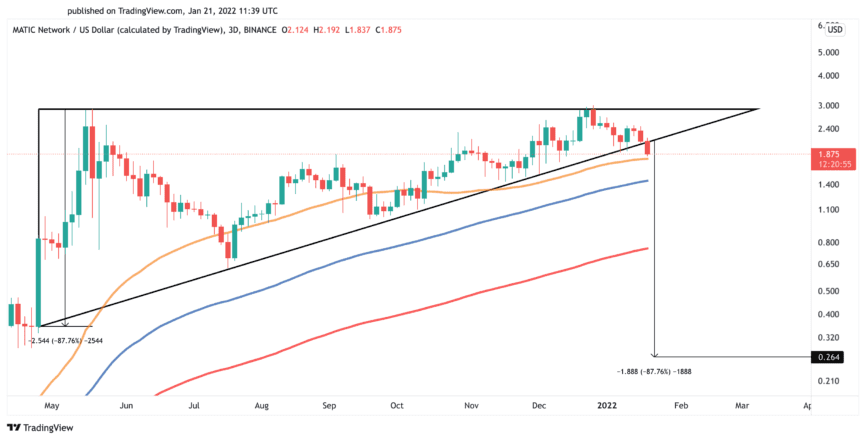
While it reached a new all-time high last month, 15th-ranked cryptocurrency has been developing a descending triangle on its three-day chart since late April 2021. The series of higher lows recorded since then have formed the pattern’s hypotenuse, while the $2.90 resistance barrier has created the x-axis.
A recent spike in selling pressure appears to have pushed MATIC beyond the triangle’s hypotenuse, which can be considered a bearish breakout. If it can print a daily candlestick close below the 50-three-day moving average at $1.80, it could trend down by as much as 87% toward $0.27.
The bearish target derives from the measurement of the triangle’s y-axis added downward from the breakout point.
Polygon needs to stay above the 50-three-day moving average to try to invalidate the bearish outlook. More importantly, it would need to gain enough bullish momentum to retest the $2.90 resistance wall and turn it into support. At that point, it could potentially resume its uptrend and return to new highs.
Disclosure: At the time of writing, the author of this piece owned BTC and ETH.
Share this article
