 Earn with Nexo

Monero Price Analysis XMR / USD: Power Struggle
Despite the selling pressure, Monero is still fighting.
- Monero has a bearish short-term trading bias, with the XMR / USD pair performing a major bearish breakout
- The four-hour time frame shows the presence of a bearish head and shoulders pattern with a $37.00 downside target.
- The daily time frame shows that a bullish inverted head and shoulders pattern remains valid
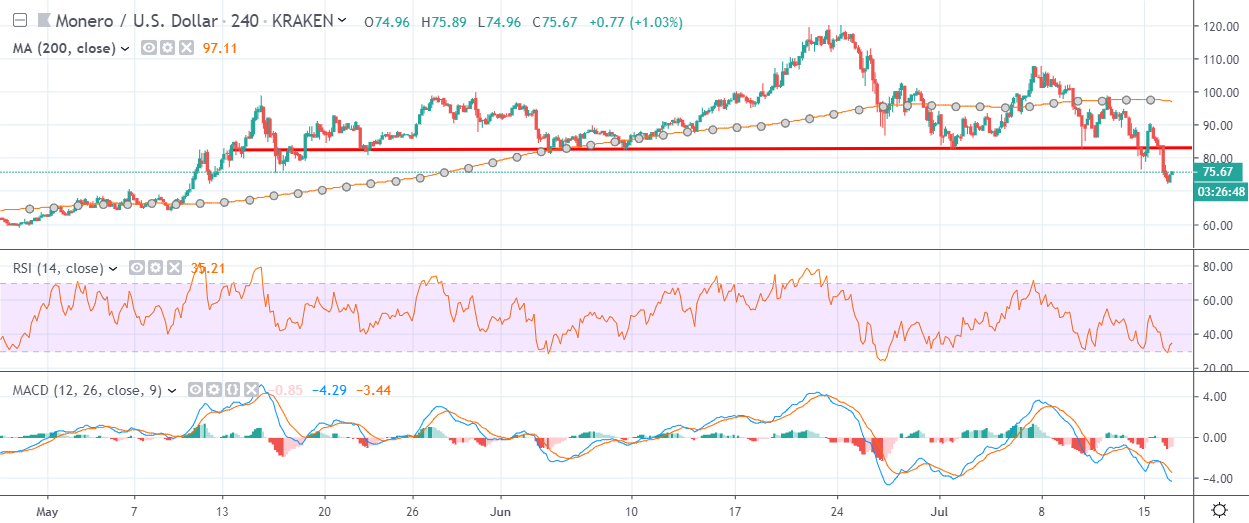
Monero / USD Short-term price analysis
Monero has a bearish short-term outlook, with the cryptocurrency tumbling to its lowest trading level since May 2019.
The four-hour time frame shows that a major bearish breakout has now occurred, with XRM/USD bears triggering a head and shoulders pattern into action.
Technical indicators are bearish on the four-hour time frame and continue to issue sell signals.
Pattern Watch
Traders should note that the bearish pattern has a downside projection of around $37.00.
Relative Strength Index
The RSI indicator is also bearish on the four-hour time frame, although it is attempting to correct from oversold territory.
MACD Indicator
The MACD indicator has turned bearish on the four-hour time frame and continues to generate a sell signal.
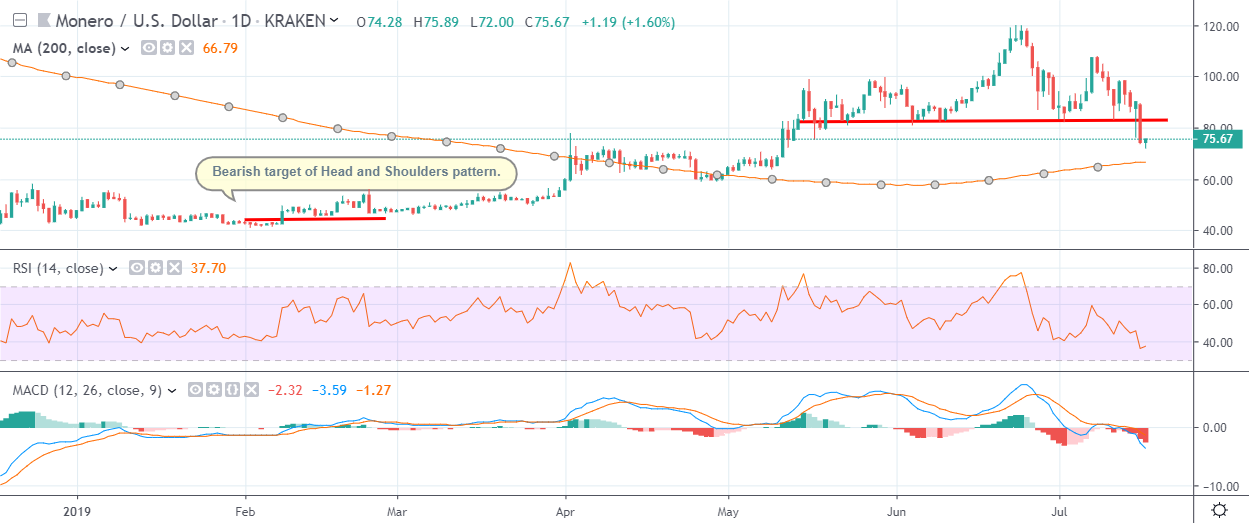
Monero / USD Medium-term price analysis
Monero retains its bullish medium-term outlook, with the cryptocurrency still trading above its trend defining 200-day moving average.
The daily time frame is showing that a sizeable head and shoulders pattern is also in play, with the $43.00 level the overall target of the bearish pattern.
Technical indicators on the daily time frame are bearish and continue to issue a strong sell signal.
Pattern Watch
Traders should note that an inverted head and shoulders pattern is still present on the daily time frame. The overall downside projection of the bearish pattern currently in play would fail to invalidate the larger bullish pattern.
Relative Strength Index
The RSI indicator has turned bearish on the daily time frame and is now issuing a strong sell signal.
MACD Indicator
The MACD Indicator on the daily time frame is bearish and is currently generating a sell signal.
Conclusion
Monero could start to come under increasing technical selling pressure as the bearish head and shoulders pattern across both time frames unfolds.
The key development to watch will be how far the downside in the XMR / USD pair extends and if bears can invalidate the huge bullish pattern on the daily time frame.
Check out the Monero coin guide for a quick look into the privacy coin.
For a deeper look we published a detailed DARE, part of our SIMETRI research offering.