Monero / USD Technical Analysis: Double Time

Share this article
- Monero is bullish short-term after breaking above its four-week trading range
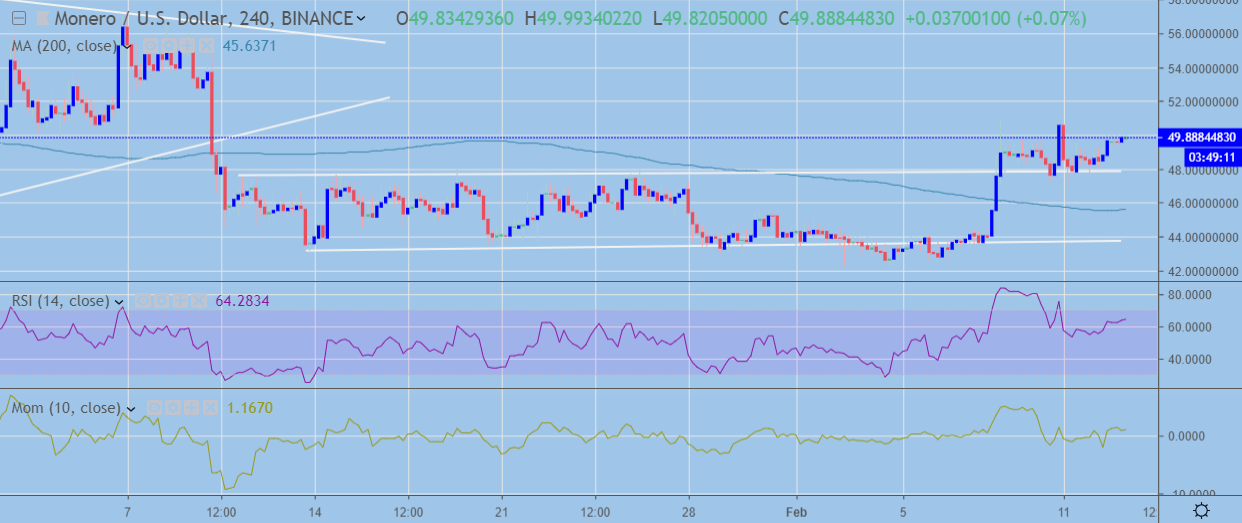
- The four-hour time frame also shows the formation of a bullish inverted head and shoulders pattern
- The XMR / USD pair remains bearish over the medium-term with the cryptocurrency still trading at depressed levels
Monero / USD Short-term price analysis
In the short-term, Monero is bullish with the cryptocurrency recently breaking above its four-week trading range. A bullish inverted head and shoulders pattern is also visible on the four-hour time frame.
Technical indicators have recently turned bullish and after a brief correction lower appear ready to push higher once again.
The 58.0000 level is likely to be the near-term bullish target, as it represents the highest trading level since the XMR / USD pair hit a record low during the middle of December last year.
Pattern Watch
The bullish inverted head and shoulders pattern is the key development to watch in the short-term, traders should note buyers have successfully defended the most recent technical test of neckline support.

XMR / USD H4 Chart (Source: TradingView)
Moving Averages
Monero is trading above all key moving averages on the four-hour time horizon.
Relative Strength Index
The RSI indicator is bullish on the four-hour time frame and shows that buyers have the upper hand.
Momentum Indicator
The Stochastic indicator is showing possible bearish divergence, with momentum declining while price is recovering higher.
Monero / USD Medium-term price analysis
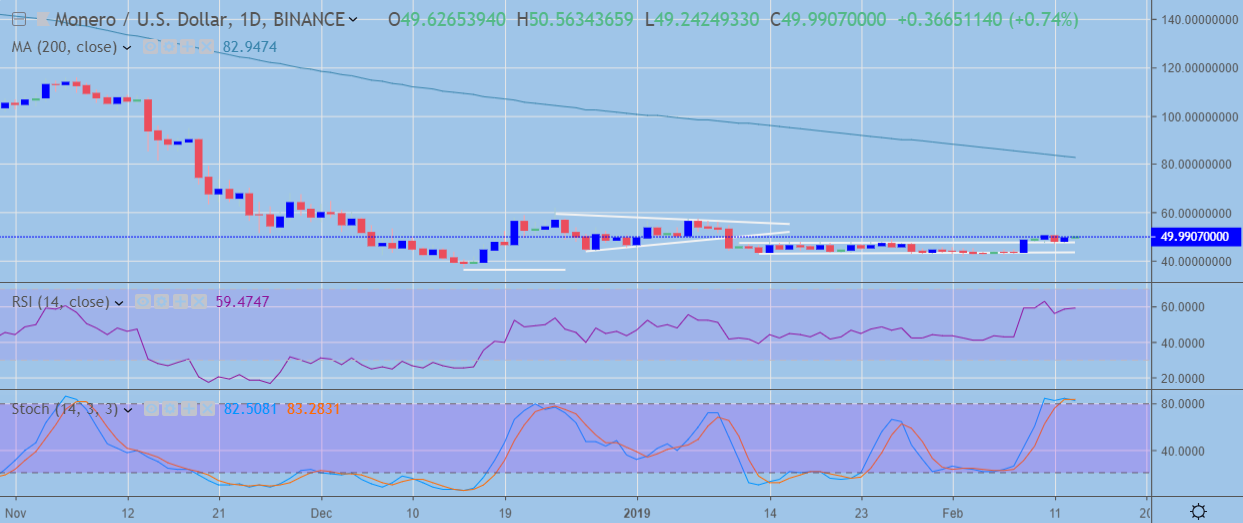
Monero retains a bearish medium-term outlook, despite the recent upside range break and short-term bullish outlook.
The early month recovery in the cryptocurrency has been fairly muted in in terms of percentage gains, and also in comparison to the steep losses the pair incurred during 2018. Traders should note that price still trades well below the pair’s 200-day moving average.
Technical indicators on the daily time frame appear to be approaching overstretched levels, particularly the Stochastic Indicator.
Pattern Watch
Traders should note that a potential double-bottom formation may be in place, which could generate significant upside if confirmed over the medium-term.

XMR / USD Daily Chart (Source: TradingView)
Relative Strength Index
The RSI indicator is bullish on the daily time frame and is starting to show signs of upside exhaustion.
Stochastic Indicator
The Stochastic Indicator on the mentioned time frame is extremely overbought and is starting to turn lower, which is a bearish sign for the XMR / USD pair over the medium-term.
Conclusion
Monero is showing strong bullish signs in the short-term, with buyers likely to target towards the 58.0000 level if the rally continues.
The medium-term outlook remains bearish for the XMR / USD pair, with the cryptocurrency still trading at depressed levels and needing to nearly double its current market capitalization before it reaches its 200-day moving average.
Decentral Media, Inc., the publisher of Crypto Briefing, is not an investment advisor and does not offer or provide investment advice or other financial advice. Nothing on this website constitutes, or should be relied on as, investment advice or financial advice of any kind. Specifically, none of the information on this website constitutes, or should be relied on as, a suggestion, offer, or other solicitation to engage in, or refrain from engaging in, any purchase, sale, or any other any investment-related activity with respect to any transaction. You should never make an investment decision on an investment based solely on the information on our website, and you should never interpret or otherwise rely on any of the information on this website as investment advice. We strongly recommend that you consult a licensed investment advisor or other qualified financial professional if you are seeking investment advice on an investment.
