
NEM Price Analysis XEM / USD: Short-term Bounce
XEM has stopped falling, but the medium-term outlook is still depressed.
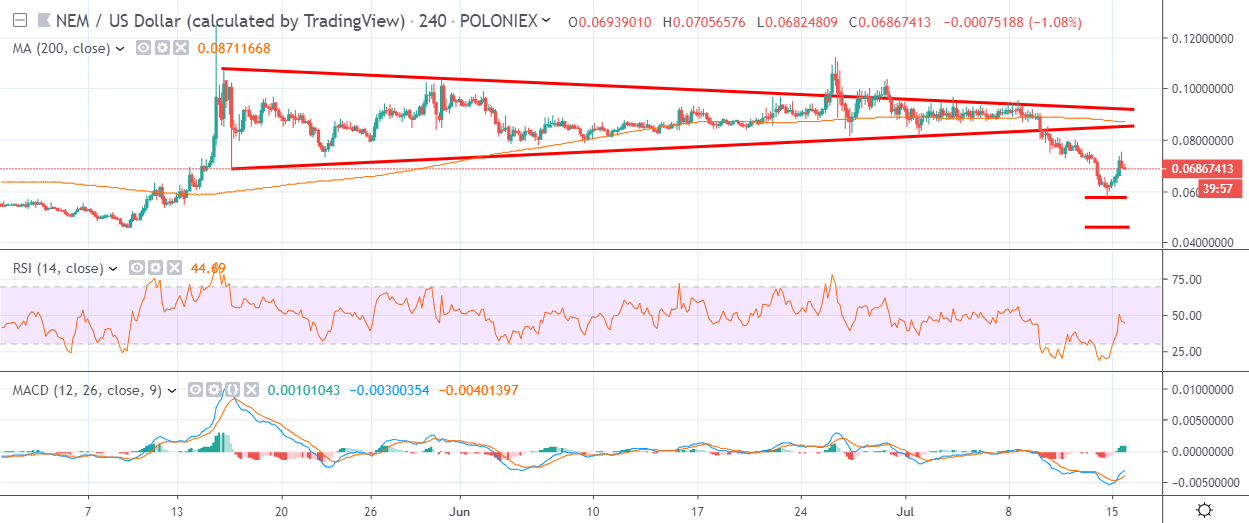
- NEM has a bearish short-term-trading bias, with the XEM / USD pair still holding below its 200-period moving average on the four-hour time frame
- The four-hour time frame shows that the bearish breakout from the neutral wedge pattern has now reached its downside target
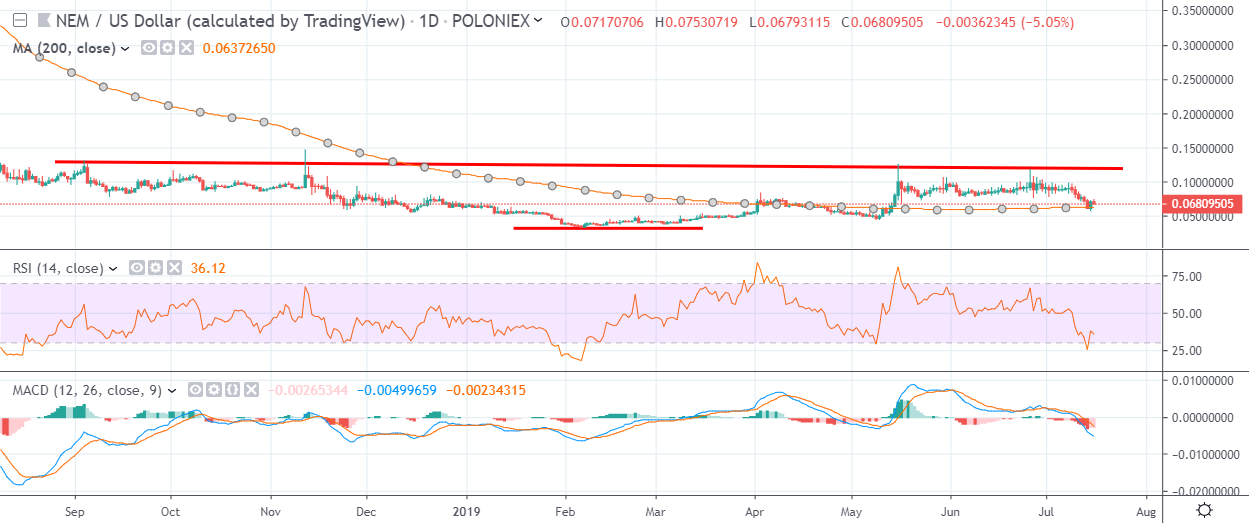
- The daily time frame continues to show price an extremely large bullish pattern
NEM / USD Short-term price analysis
The XEM / USD pair has a bearish short-term trading outlook, with the cryptocurrency still trading well below its 200-period moving average on the four-hour time frame.
The four-hour time frame shows that the bearish breakout from neutral wedge pattern has reached its full downside projection, prompting a minor technical reversal.
Technical indicators on the four-hour time frame are attempting to move higher alongside the recent near-term recovery in the XEM / USD pair.
Pattern Watch
Traders should monitor technical tests back towards the neutral wedge pattern.
Relative Strength Index
The RSI indicator is rising on the four-hour time frame, although it has yet to turn technically bullish.
MACD Indicator
The MACD indicator on the four-hour time frame is bullish, with both the MACD signal line and histogram generating buy signals.
NEM / USD Medium-term price analysis
NEM has a neutral medium-term trading outlook, with the cryptocurrency currently probing towards its trend defining 200-day moving average.
The daily time frame shows that an extremely large inverted head and shoulders pattern remains valid, despite the recent decline in the XEM / USD pair.
Technical indicators on the daily time frame are mixed and currently failing to generate a clear trading signal.
Pattern Watch
Traders should note that dip-buying is still favored while the large inverted head and shoulders pattern on the daily time frame remains valid.
Relative Strength Index
The RSI indicator on the daily time frame is attempting to recover, although the indicator remains technically bearish.
MACD Indicator
The MACD Indicator is conflicted on the daily time frame, with the MACD signal providing a sell signal while the histogram turns higher.
Conclusion
NEM is undergoing a strong technical rebound after the recent bearish breakout reached its overall downside objective.
If XEM / USD buyers can continue to defend the pair’s 200-day moving average, the bullish pattern on the daily time frame still has a high probability of unfolding over the medium-term.
Check out our coin guide for NEM to get a quick glance of the essentials.
For a deeper dive, our DARE for NEM is available.