NEM / USD Technical Analysis: Opposing Timeframes

Share this article
- NEM is bullish in the short-term with a strong upside move currently underway
- The four-hour time frame shows a bullish inverted head and shoulders pattern
- The medium-term time outlook remains bearish, although bullish momentum is building on the daily time frame
XEM / USD Short-term price analysis
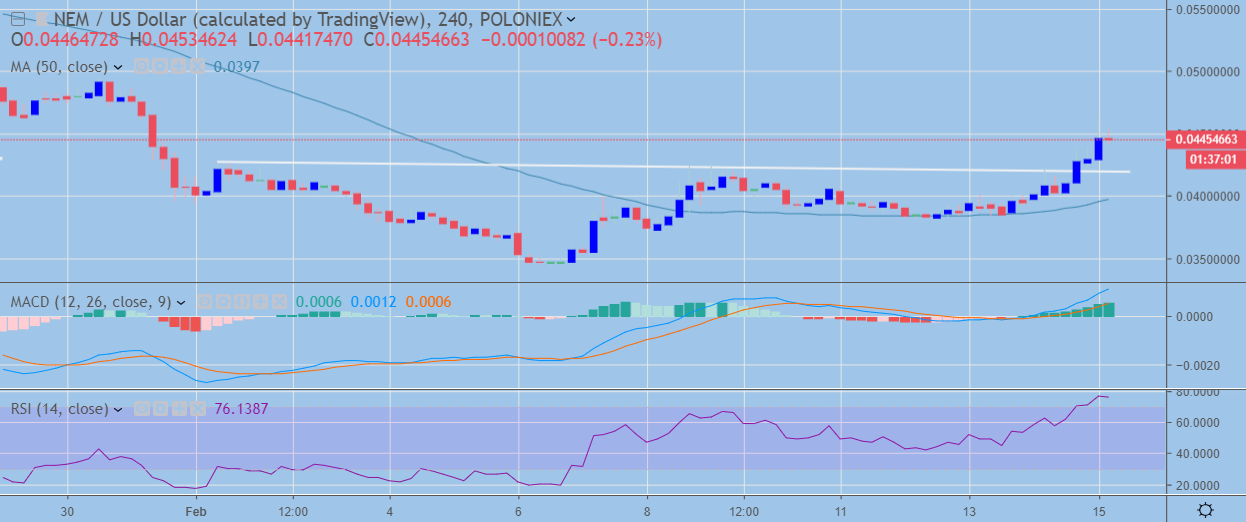
In the short-term, NEM is bullish with the four-hour time frame showing that a strong technical breakout is underway.
Price has broken above the neckline of a bullish inverted head and shoulders pattern, with technical indicators on the four-hour time frame also turning bullish.
Overall, NEM has staged a strong recovery after coming under heavy selling pressure at the beginning of February. Traders should watch this pair as a major price floor may have been formed.
XEM / USD H4 Chart (Source: TradingView)
Pattern Watch
Traders should watch for a further advance in the XEM / USD pair towards the January 30th trading high as it has the potential to create a much larger inverted head and shoulders pattern.
MACD Indicator
The MACD indicator on the four-hour time frame has turned strongly bullish.
Relative Strength Index
The RSI indicator has moved into overbought territory and is showing signs of possible upside exhaustion.
XEM / USD Medium-term price analysis
NEM remains bearish in the medium-term, with the daily time frame chart showing price recovering back inside a descending price channel.
Traders should note that sellers failed to hold price outside of the price channel and we may well see a recovery in the XEM / USD pair towards the upper end of the price channel.
Traders should be cautious on this pair due to the protracted down trend it finds itself in, and also a large head and shoulders pattern remains valid across the daily, weekly and monthly timeframes.

XEM / USD Daily Chart (Source: TradingView)
Pattern Watch
Aside from the descending price channel, a bullish inverted head and shoulders pattern is visible on the daily time frame.
MACD + RSI Indicators
The MACD indicator is bullish on the daily time frame and shows scope for further upside, while the RSI indicator is generating a strong price buy signal.
Conclusion
NEM is likely to continue to grind higher in the short-term due to the recent breakout and bullish signals coming from indicators on both the four-hour and daily time frames.
The overall medium-term bearish outlook is likely to remain in place until we see a strong breakout from the descending price channel on the daily time frame.
Decentral Media, Inc., the publisher of Crypto Briefing, is not an investment advisor and does not offer or provide investment advice or other financial advice. Nothing on this website constitutes, or should be relied on as, investment advice or financial advice of any kind. Specifically, none of the information on this website constitutes, or should be relied on as, a suggestion, offer, or other solicitation to engage in, or refrain from engaging in, any purchase, sale, or any other any investment-related activity with respect to any transaction. You should never make an investment decision on an investment based solely on the information on our website, and you should never interpret or otherwise rely on any of the information on this website as investment advice. We strongly recommend that you consult a licensed investment advisor or other qualified financial professional if you are seeking investment advice on an investment.
Share this article

